
Advanced Search: Build a Custom Dashboard

In the fields below, search for indicators by location, topics, population, classification, subgroup, or comparison. No fields are required, but we suggest selecting a location or two to start. In the additional search options section, select options to group and order search results. To learn more about how to customize a dashboard, see our help center.

Visit the Indicator List Page to see the full list of indicators and locations available on the site.

  • Map View
  • County : Marin Census Tracts
  • County : Marin Zip Codes
  • All Health Topics
  • All Community Topics
  • All Economy Topics
  • All Education Topics
  • All Environmental Health Topics
Search display options:

Search Results:

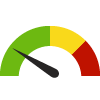
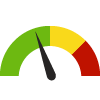
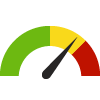
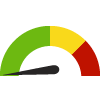
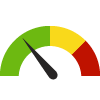
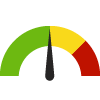
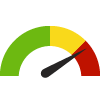
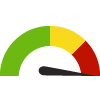
Indicator Gauge Icon Legend

Legend Colors

Red is bad, green is good, blue is not statistically different/neutral.

Compared to Distribution

an indicator guage with the arrow in the green 
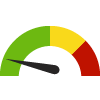
the value is in the best half of communities.

an indicator guage with the arrow in the yellow the value is in the 2nd worst quarter of communities.

an indicator guage with the arrow in the red 
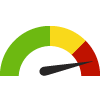
the value is in the worst quarter of communities.

Compared to Target

green circle with white tick inside it meets target; red circle with white cross inside it does not meet target.

Compared to a Single Value

green diamond with downward arrow inside it lower than the comparison value; red diamond with downward arrow inside it higher than the comparison value; blue diamond with downward arrow inside it not statistically different from comparison value.

Trend

green square outline with upward trending arrow inside it green square outline with downward trending arrow inside it non-significant change over time; green square with upward trending arrow inside it green square with downward trending arrow inside it significant change over time; blue square with equals sign no change over time.

Compared to Prior Value

green triangle with upward trending arrow inside it higher than the previous measurement period; green triangle with downward trending arrow inside it lower than the previous measurement period; blue equals sign no statistically different change  from previous measurement period.

More information about the gauges and icons

Health / Alcohol & Drug Use

Health / Alcohol & Drug Use

Health / Alcohol & Drug Use

Adults who Binge Drink

Value
Compared to:

Health / Alcohol & Drug Use

Adults who Binge Drink

Value
Compared to:

Adults who Binge Drink County: Marin

Current Value:

Adults who Binge Drink County: Marin

14.8%
(2021)
Compared to:
Compared to CA Counties, Marin has a value of 14.8% which is in the best 50% of counties. Counties in the best 50% have a value lower than 15.3% while counties in the worst 25% have a value higher than 15.8%.
CA Counties
The distribution is based on data from 58 California counties.
Compared to U.S. Counties, Marin has a value of 14.8% which is in the best 50% of counties. Counties in the best 50% have a value lower than 15.5% while counties in the worst 25% have a value higher than 17.0%.
U.S. Counties
The distribution is based on data from 3,074 U.S. counties and county equivalents.
Compared to the US Value (15.5%), Marin has a value of 14.8% which is lower and better.
US Value
(15.5%)
The regional value is compared to the national value.

Adults who Binge Drink Census Place: Alto

Current Value:

Adults who Binge Drink Census Place: Alto

17.7%
(2021)
Compared to:
Compared to CA Census Places, Alto has a value of 17.7% which is in the worst 25% of census places. Census places in the best 50% have a value lower than 15.8% while census places in the worst 25% have a value higher than 17.0%.
CA Census Places
The distribution is based on data from 1,472 locales.
Compared to U.S. Census Places, Alto has a value of 17.7% which is in the 2nd worst quartile of census places. Census places in the best 50% have a value lower than 16.4% while census places in the worst 25% have a value higher than 18.2%.
U.S. Census Places
The distribution is based on data from 27,528 U.S. Census Places.
Compared to the Marin, CA County Value (14.8%), Alto has a value of 17.7% which is higher and worse.
Marin, CA County Value
(14.8%)
The regional value is compared to the Marin County value.
Compared to the US Value (15.5%), Alto has a value of 17.7% which is higher and worse.
US Value
(15.5%)
The regional value is compared to the national value.

Adults who Binge Drink Census Place: Belvedere

Current Value:

Adults who Binge Drink Census Place: Belvedere

12.7%
(2021)
Compared to:
Compared to CA Census Places, Belvedere has a value of 12.7% which is in the best 50% of census places. Census places in the best 50% have a value lower than 15.8% while census places in the worst 25% have a value higher than 17.0%.
CA Census Places
The distribution is based on data from 1,472 locales.
Compared to U.S. Census Places, Belvedere has a value of 12.7% which is in the best 50% of census places. Census places in the best 50% have a value lower than 16.4% while census places in the worst 25% have a value higher than 18.2%.
U.S. Census Places
The distribution is based on data from 27,528 U.S. Census Places.
Compared to the Marin, CA County Value (14.8%), Belvedere has a value of 12.7% which is lower and better.
Marin, CA County Value
(14.8%)
The regional value is compared to the Marin County value.
Compared to the US Value (15.5%), Belvedere has a value of 12.7% which is lower and better.
US Value
(15.5%)
The regional value is compared to the national value.

Adults who Binge Drink Census Place: Black Point-Green Point

Current Value:

Adults who Binge Drink Census Place: Black Point-Green Point

15.1%
(2021)
Compared to:
Compared to CA Census Places, Black Point-Green Point has a value of 15.1% which is in the best 50% of census places. Census places in the best 50% have a value lower than 15.8% while census places in the worst 25% have a value higher than 17.0%.
CA Census Places
The distribution is based on data from 1,472 locales.
Compared to U.S. Census Places, Black Point-Green Point has a value of 15.1% which is in the best 50% of census places. Census places in the best 50% have a value lower than 16.4% while census places in the worst 25% have a value higher than 18.2%.
U.S. Census Places
The distribution is based on data from 27,528 U.S. Census Places.
Compared to the Marin, CA County Value (14.8%), Black Point-Green Point has a value of 15.1% which is higher and worse.
Marin, CA County Value
(14.8%)
The regional value is compared to the Marin County value.
Compared to the US Value (15.5%), Black Point-Green Point has a value of 15.1% which is lower and better.
US Value
(15.5%)
The regional value is compared to the national value.

Adults who Binge Drink Census Place: Bolinas

Current Value:

Adults who Binge Drink Census Place: Bolinas

15.7%
(2021)
Compared to:
Compared to CA Census Places, Bolinas has a value of 15.7% which is in the best 50% of census places. Census places in the best 50% have a value lower than 15.8% while census places in the worst 25% have a value higher than 17.0%.
CA Census Places
The distribution is based on data from 1,472 locales.
Compared to U.S. Census Places, Bolinas has a value of 15.7% which is in the best 50% of census places. Census places in the best 50% have a value lower than 16.4% while census places in the worst 25% have a value higher than 18.2%.
U.S. Census Places
The distribution is based on data from 27,528 U.S. Census Places.
Compared to the Marin, CA County Value (14.8%), Bolinas has a value of 15.7% which is higher and worse.
Marin, CA County Value
(14.8%)
The regional value is compared to the Marin County value.
Compared to the US Value (15.5%), Bolinas has a value of 15.7% which is higher and worse.
US Value
(15.5%)
The regional value is compared to the national value.

Adults who Binge Drink Census Place: Corte Madera

Current Value:

Adults who Binge Drink Census Place: Corte Madera

15.8%
(2021)
Compared to:
Compared to CA Census Places, Corte Madera has a value of 15.8% which is in the best 50% of census places. Census places in the best 50% have a value lower than 15.8% while census places in the worst 25% have a value higher than 17.0%.
CA Census Places
The distribution is based on data from 1,472 locales.
Compared to U.S. Census Places, Corte Madera has a value of 15.8% which is in the best 50% of census places. Census places in the best 50% have a value lower than 16.4% while census places in the worst 25% have a value higher than 18.2%.
U.S. Census Places
The distribution is based on data from 27,528 U.S. Census Places.
Compared to the Marin, CA County Value (14.8%), Corte Madera has a value of 15.8% which is higher and worse.
Marin, CA County Value
(14.8%)
The regional value is compared to the Marin County value.
Compared to the US Value (15.5%), Corte Madera has a value of 15.8% which is higher and worse.
US Value
(15.5%)
The regional value is compared to the national value.

Adults who Binge Drink Census Place: Dillon Beach

Current Value:

Adults who Binge Drink Census Place: Dillon Beach

13.7%
(2021)
Compared to:
Compared to CA Census Places, Dillon Beach has a value of 13.7% which is in the best 50% of census places. Census places in the best 50% have a value lower than 15.8% while census places in the worst 25% have a value higher than 17.0%.
CA Census Places
The distribution is based on data from 1,472 locales.
Compared to U.S. Census Places, Dillon Beach has a value of 13.7% which is in the best 50% of census places. Census places in the best 50% have a value lower than 16.4% while census places in the worst 25% have a value higher than 18.2%.
U.S. Census Places
The distribution is based on data from 27,528 U.S. Census Places.
Compared to the Marin, CA County Value (14.8%), Dillon Beach has a value of 13.7% which is lower and better.
Marin, CA County Value
(14.8%)
The regional value is compared to the Marin County value.
Compared to the US Value (15.5%), Dillon Beach has a value of 13.7% which is lower and better.
US Value
(15.5%)
The regional value is compared to the national value.

Adults who Binge Drink Census Place: Fairfax

Current Value:

Adults who Binge Drink Census Place: Fairfax

17.2%
(2021)
Compared to:
Compared to CA Census Places, Fairfax has a value of 17.2% which is in the worst 25% of census places. Census places in the best 50% have a value lower than 15.8% while census places in the worst 25% have a value higher than 17.0%.
CA Census Places
The distribution is based on data from 1,472 locales.
Compared to U.S. Census Places, Fairfax has a value of 17.2% which is in the 2nd worst quartile of census places. Census places in the best 50% have a value lower than 16.4% while census places in the worst 25% have a value higher than 18.2%.
U.S. Census Places
The distribution is based on data from 27,528 U.S. Census Places.
Compared to the Marin, CA County Value (14.8%), Fairfax has a value of 17.2% which is higher and worse.
Marin, CA County Value
(14.8%)
The regional value is compared to the Marin County value.
Compared to the US Value (15.5%), Fairfax has a value of 17.2% which is higher and worse.
US Value
(15.5%)
The regional value is compared to the national value.

Adults who Binge Drink Census Place: Inverness

Current Value:

Adults who Binge Drink Census Place: Inverness

13.6%
(2021)
Compared to:
Compared to CA Census Places, Inverness has a value of 13.6% which is in the best 50% of census places. Census places in the best 50% have a value lower than 15.8% while census places in the worst 25% have a value higher than 17.0%.
CA Census Places
The distribution is based on data from 1,472 locales.
Compared to U.S. Census Places, Inverness has a value of 13.6% which is in the best 50% of census places. Census places in the best 50% have a value lower than 16.4% while census places in the worst 25% have a value higher than 18.2%.
U.S. Census Places
The distribution is based on data from 27,528 U.S. Census Places.
Compared to the Marin, CA County Value (14.8%), Inverness has a value of 13.6% which is lower and better.
Marin, CA County Value
(14.8%)
The regional value is compared to the Marin County value.
Compared to the US Value (15.5%), Inverness has a value of 13.6% which is lower and better.
US Value
(15.5%)
The regional value is compared to the national value.

Adults who Binge Drink Census Place: Kentfield

Current Value:

Adults who Binge Drink Census Place: Kentfield

15.1%
(2021)
Compared to:
Compared to CA Census Places, Kentfield has a value of 15.1% which is in the best 50% of census places. Census places in the best 50% have a value lower than 15.8% while census places in the worst 25% have a value higher than 17.0%.
CA Census Places
The distribution is based on data from 1,472 locales.
Compared to U.S. Census Places, Kentfield has a value of 15.1% which is in the best 50% of census places. Census places in the best 50% have a value lower than 16.4% while census places in the worst 25% have a value higher than 18.2%.
U.S. Census Places
The distribution is based on data from 27,528 U.S. Census Places.
Compared to the Marin, CA County Value (14.8%), Kentfield has a value of 15.1% which is higher and worse.
Marin, CA County Value
(14.8%)
The regional value is compared to the Marin County value.
Compared to the US Value (15.5%), Kentfield has a value of 15.1% which is lower and better.
US Value
(15.5%)
The regional value is compared to the national value.

Adults who Binge Drink Census Place: Lagunitas-Forest Knolls

Current Value:

Adults who Binge Drink Census Place: Lagunitas-Forest Knolls

16.0%
(2021)
Compared to:
Compared to CA Census Places, Lagunitas-Forest Knolls has a value of 16.0% which is in the 2nd worst quartile of census places. Census places in the best 50% have a value lower than 15.8% while census places in the worst 25% have a value higher than 17.0%.
CA Census Places
The distribution is based on data from 1,472 locales.
Compared to U.S. Census Places, Lagunitas-Forest Knolls has a value of 16.0% which is in the best 50% of census places. Census places in the best 50% have a value lower than 16.4% while census places in the worst 25% have a value higher than 18.2%.
U.S. Census Places
The distribution is based on data from 27,528 U.S. Census Places.
Compared to the Marin, CA County Value (14.8%), Lagunitas-Forest Knolls has a value of 16.0% which is higher and worse.
Marin, CA County Value
(14.8%)
The regional value is compared to the Marin County value.
Compared to the US Value (15.5%), Lagunitas-Forest Knolls has a value of 16.0% which is higher and worse.
US Value
(15.5%)
The regional value is compared to the national value.

Adults who Binge Drink Census Place: Larkspur

Current Value:

Adults who Binge Drink Census Place: Larkspur

14.8%
(2021)
Compared to:
Compared to CA Census Places, Larkspur has a value of 14.8% which is in the best 50% of census places. Census places in the best 50% have a value lower than 15.8% while census places in the worst 25% have a value higher than 17.0%.
CA Census Places
The distribution is based on data from 1,472 locales.
Compared to U.S. Census Places, Larkspur has a value of 14.8% which is in the best 50% of census places. Census places in the best 50% have a value lower than 16.4% while census places in the worst 25% have a value higher than 18.2%.
U.S. Census Places
The distribution is based on data from 27,528 U.S. Census Places.
Compared to the Marin, CA County Value (14.8%), Larkspur has a value of 14.8%.
Marin, CA County Value
(14.8%)
The regional value is compared to the Marin County value.
Compared to the US Value (15.5%), Larkspur has a value of 14.8% which is lower and better.
US Value
(15.5%)
The regional value is compared to the national value.

Adults who Binge Drink Census Place: Lucas Valley-Marinwood

Current Value:

Adults who Binge Drink Census Place: Lucas Valley-Marinwood

14.7%
(2021)
Compared to:
Compared to CA Census Places, Lucas Valley-Marinwood has a value of 14.7% which is in the best 50% of census places. Census places in the best 50% have a value lower than 15.8% while census places in the worst 25% have a value higher than 17.0%.
CA Census Places
The distribution is based on data from 1,472 locales.
Compared to U.S. Census Places, Lucas Valley-Marinwood has a value of 14.7% which is in the best 50% of census places. Census places in the best 50% have a value lower than 16.4% while census places in the worst 25% have a value higher than 18.2%.
U.S. Census Places
The distribution is based on data from 27,528 U.S. Census Places.
Compared to the Marin, CA County Value (14.8%), Lucas Valley-Marinwood has a value of 14.7% which is lower and better.
Marin, CA County Value
(14.8%)
The regional value is compared to the Marin County value.
Compared to the US Value (15.5%), Lucas Valley-Marinwood has a value of 14.7% which is lower and better.
US Value
(15.5%)
The regional value is compared to the national value.

Adults who Binge Drink Census Place: Marin City

Current Value:

Adults who Binge Drink Census Place: Marin City

14.2%
(2021)
Compared to:
Compared to CA Census Places, Marin City has a value of 14.2% which is in the best 50% of census places. Census places in the best 50% have a value lower than 15.8% while census places in the worst 25% have a value higher than 17.0%.
CA Census Places
The distribution is based on data from 1,472 locales.
Compared to U.S. Census Places, Marin City has a value of 14.2% which is in the best 50% of census places. Census places in the best 50% have a value lower than 16.4% while census places in the worst 25% have a value higher than 18.2%.
U.S. Census Places
The distribution is based on data from 27,528 U.S. Census Places.
Compared to the Marin, CA County Value (14.8%), Marin City has a value of 14.2% which is lower and better.
Marin, CA County Value
(14.8%)
The regional value is compared to the Marin County value.
Compared to the US Value (15.5%), Marin City has a value of 14.2% which is lower and better.
US Value
(15.5%)
The regional value is compared to the national value.

Adults who Binge Drink Census Place: Mill Valley

Current Value:

Adults who Binge Drink Census Place: Mill Valley

15.3%
(2021)
Compared to:
Compared to CA Census Places, Mill Valley has a value of 15.3% which is in the best 50% of census places. Census places in the best 50% have a value lower than 15.8% while census places in the worst 25% have a value higher than 17.0%.
CA Census Places
The distribution is based on data from 1,472 locales.
Compared to U.S. Census Places, Mill Valley has a value of 15.3% which is in the best 50% of census places. Census places in the best 50% have a value lower than 16.4% while census places in the worst 25% have a value higher than 18.2%.
U.S. Census Places
The distribution is based on data from 27,528 U.S. Census Places.
Compared to the Marin, CA County Value (14.8%), Mill Valley has a value of 15.3% which is higher and worse.
Marin, CA County Value
(14.8%)
The regional value is compared to the Marin County value.
Compared to the US Value (15.5%), Mill Valley has a value of 15.3% which is lower and better.
US Value
(15.5%)
The regional value is compared to the national value.

Adults who Binge Drink Census Place: Muir Beach

Current Value:

Adults who Binge Drink Census Place: Muir Beach

15.4%
(2021)
Compared to:
Compared to CA Census Places, Muir Beach has a value of 15.4% which is in the best 50% of census places. Census places in the best 50% have a value lower than 15.8% while census places in the worst 25% have a value higher than 17.0%.
CA Census Places
The distribution is based on data from 1,472 locales.
Compared to U.S. Census Places, Muir Beach has a value of 15.4% which is in the best 50% of census places. Census places in the best 50% have a value lower than 16.4% while census places in the worst 25% have a value higher than 18.2%.
U.S. Census Places
The distribution is based on data from 27,528 U.S. Census Places.
Compared to the Marin, CA County Value (14.8%), Muir Beach has a value of 15.4% which is higher and worse.
Marin, CA County Value
(14.8%)
The regional value is compared to the Marin County value.
Compared to the US Value (15.5%), Muir Beach has a value of 15.4% which is lower and better.
US Value
(15.5%)
The regional value is compared to the national value.

Adults who Binge Drink Census Place: Nicasio

Current Value:

Adults who Binge Drink Census Place: Nicasio

17.1%
(2021)
Compared to:
Compared to CA Census Places, Nicasio has a value of 17.1% which is in the worst 25% of census places. Census places in the best 50% have a value lower than 15.8% while census places in the worst 25% have a value higher than 17.0%.
CA Census Places
The distribution is based on data from 1,472 locales.
Compared to U.S. Census Places, Nicasio has a value of 17.1% which is in the 2nd worst quartile of census places. Census places in the best 50% have a value lower than 16.4% while census places in the worst 25% have a value higher than 18.2%.
U.S. Census Places
The distribution is based on data from 27,528 U.S. Census Places.
Compared to the Marin, CA County Value (14.8%), Nicasio has a value of 17.1% which is higher and worse.
Marin, CA County Value
(14.8%)
The regional value is compared to the Marin County value.
Compared to the US Value (15.5%), Nicasio has a value of 17.1% which is higher and worse.
US Value
(15.5%)
The regional value is compared to the national value.

Adults who Binge Drink Census Place: Novato

Current Value:

Adults who Binge Drink Census Place: Novato

16.1%
(2021)
Compared to:
Compared to CA Census Places, Novato has a value of 16.1% which is in the 2nd worst quartile of census places. Census places in the best 50% have a value lower than 15.8% while census places in the worst 25% have a value higher than 17.0%.
CA Census Places
The distribution is based on data from 1,472 locales.
Compared to U.S. Census Places, Novato has a value of 16.1% which is in the best 50% of census places. Census places in the best 50% have a value lower than 16.4% while census places in the worst 25% have a value higher than 18.2%.
U.S. Census Places
The distribution is based on data from 27,528 U.S. Census Places.
Compared to the Marin, CA County Value (14.8%), Novato has a value of 16.1% which is higher and worse.
Marin, CA County Value
(14.8%)
The regional value is compared to the Marin County value.
Compared to the US Value (15.5%), Novato has a value of 16.1% which is higher and worse.
US Value
(15.5%)
The regional value is compared to the national value.

Adults who Binge Drink Census Place: Point Reyes Station

Current Value:

Adults who Binge Drink Census Place: Point Reyes Station

14.5%
(2021)
Compared to:
Compared to CA Census Places, Point Reyes Station has a value of 14.5% which is in the best 50% of census places. Census places in the best 50% have a value lower than 15.8% while census places in the worst 25% have a value higher than 17.0%.
CA Census Places
The distribution is based on data from 1,472 locales.
Compared to U.S. Census Places, Point Reyes Station has a value of 14.5% which is in the best 50% of census places. Census places in the best 50% have a value lower than 16.4% while census places in the worst 25% have a value higher than 18.2%.
U.S. Census Places
The distribution is based on data from 27,528 U.S. Census Places.
Compared to the Marin, CA County Value (14.8%), Point Reyes Station has a value of 14.5% which is lower and better.
Marin, CA County Value
(14.8%)
The regional value is compared to the Marin County value.
Compared to the US Value (15.5%), Point Reyes Station has a value of 14.5% which is lower and better.
US Value
(15.5%)
The regional value is compared to the national value.

Adults who Binge Drink Census Place: Ross

Current Value:

Adults who Binge Drink Census Place: Ross

15.5%
(2021)
Compared to:
Compared to CA Census Places, Ross has a value of 15.5% which is in the best 50% of census places. Census places in the best 50% have a value lower than 15.8% while census places in the worst 25% have a value higher than 17.0%.
CA Census Places
The distribution is based on data from 1,472 locales.
Compared to U.S. Census Places, Ross has a value of 15.5% which is in the best 50% of census places. Census places in the best 50% have a value lower than 16.4% while census places in the worst 25% have a value higher than 18.2%.
U.S. Census Places
The distribution is based on data from 27,528 U.S. Census Places.
Compared to the Marin, CA County Value (14.8%), Ross has a value of 15.5% which is higher and worse.
Marin, CA County Value
(14.8%)
The regional value is compared to the Marin County value.
Compared to the US Value (15.5%), Ross has a value of 15.5%.
US Value
(15.5%)
The regional value is compared to the national value.

Adults who Binge Drink Census Place: San Anselmo

Current Value:

Adults who Binge Drink Census Place: San Anselmo

16.9%
(2021)
Compared to:
Compared to CA Census Places, San Anselmo has a value of 16.9% which is in the 2nd worst quartile of census places. Census places in the best 50% have a value lower than 15.8% while census places in the worst 25% have a value higher than 17.0%.
CA Census Places
The distribution is based on data from 1,472 locales.
Compared to U.S. Census Places, San Anselmo has a value of 16.9% which is in the 2nd worst quartile of census places. Census places in the best 50% have a value lower than 16.4% while census places in the worst 25% have a value higher than 18.2%.
U.S. Census Places
The distribution is based on data from 27,528 U.S. Census Places.
Compared to the Marin, CA County Value (14.8%), San Anselmo has a value of 16.9% which is higher and worse.
Marin, CA County Value
(14.8%)
The regional value is compared to the Marin County value.
Compared to the US Value (15.5%), San Anselmo has a value of 16.9% which is higher and worse.
US Value
(15.5%)
The regional value is compared to the national value.

Adults who Binge Drink Census Place: San Geronimo

Current Value:

Adults who Binge Drink Census Place: San Geronimo

15.3%
(2021)
Compared to:
Compared to CA Census Places, San Geronimo has a value of 15.3% which is in the best 50% of census places. Census places in the best 50% have a value lower than 15.8% while census places in the worst 25% have a value higher than 17.0%.
CA Census Places
The distribution is based on data from 1,472 locales.
Compared to U.S. Census Places, San Geronimo has a value of 15.3% which is in the best 50% of census places. Census places in the best 50% have a value lower than 16.4% while census places in the worst 25% have a value higher than 18.2%.
U.S. Census Places
The distribution is based on data from 27,528 U.S. Census Places.
Compared to the Marin, CA County Value (14.8%), San Geronimo has a value of 15.3% which is higher and worse.
Marin, CA County Value
(14.8%)
The regional value is compared to the Marin County value.
Compared to the US Value (15.5%), San Geronimo has a value of 15.3% which is lower and better.
US Value
(15.5%)
The regional value is compared to the national value.

Adults who Binge Drink Census Place: San Rafael

Current Value:

Adults who Binge Drink Census Place: San Rafael

16.0%
(2021)
Compared to:
Compared to CA Census Places, San Rafael has a value of 16.0% which is in the 2nd worst quartile of census places. Census places in the best 50% have a value lower than 15.8% while census places in the worst 25% have a value higher than 17.0%.
CA Census Places
The distribution is based on data from 1,472 locales.
Compared to U.S. Census Places, San Rafael has a value of 16.0% which is in the best 50% of census places. Census places in the best 50% have a value lower than 16.4% while census places in the worst 25% have a value higher than 18.2%.
U.S. Census Places
The distribution is based on data from 27,528 U.S. Census Places.
Compared to the Marin, CA County Value (14.8%), San Rafael has a value of 16.0% which is higher and worse.
Marin, CA County Value
(14.8%)
The regional value is compared to the Marin County value.
Compared to the US Value (15.5%), San Rafael has a value of 16.0% which is higher and worse.
US Value
(15.5%)
The regional value is compared to the national value.

Adults who Binge Drink Census Place: Santa Venetia

Current Value:

Adults who Binge Drink Census Place: Santa Venetia

15.3%
(2021)
Compared to:
Compared to CA Census Places, Santa Venetia has a value of 15.3% which is in the best 50% of census places. Census places in the best 50% have a value lower than 15.8% while census places in the worst 25% have a value higher than 17.0%.
CA Census Places
The distribution is based on data from 1,472 locales.
Compared to U.S. Census Places, Santa Venetia has a value of 15.3% which is in the best 50% of census places. Census places in the best 50% have a value lower than 16.4% while census places in the worst 25% have a value higher than 18.2%.
U.S. Census Places
The distribution is based on data from 27,528 U.S. Census Places.
Compared to the Marin, CA County Value (14.8%), Santa Venetia has a value of 15.3% which is higher and worse.
Marin, CA County Value
(14.8%)
The regional value is compared to the Marin County value.
Compared to the US Value (15.5%), Santa Venetia has a value of 15.3% which is lower and better.
US Value
(15.5%)
The regional value is compared to the national value.

Adults who Binge Drink Census Place: Sausalito

Current Value:

Adults who Binge Drink Census Place: Sausalito

16.0%
(2021)
Compared to:
Compared to CA Census Places, Sausalito has a value of 16.0% which is in the 2nd worst quartile of census places. Census places in the best 50% have a value lower than 15.8% while census places in the worst 25% have a value higher than 17.0%.
CA Census Places
The distribution is based on data from 1,472 locales.
Compared to U.S. Census Places, Sausalito has a value of 16.0% which is in the best 50% of census places. Census places in the best 50% have a value lower than 16.4% while census places in the worst 25% have a value higher than 18.2%.
U.S. Census Places
The distribution is based on data from 27,528 U.S. Census Places.
Compared to the Marin, CA County Value (14.8%), Sausalito has a value of 16.0% which is higher and worse.
Marin, CA County Value
(14.8%)
The regional value is compared to the Marin County value.
Compared to the US Value (15.5%), Sausalito has a value of 16.0% which is higher and worse.
US Value
(15.5%)
The regional value is compared to the national value.

Adults who Binge Drink Census Place: Sleepy Hollow

Current Value:

Adults who Binge Drink Census Place: Sleepy Hollow

15.4%
(2021)
Compared to:
Compared to CA Census Places, Sleepy Hollow has a value of 15.4% which is in the best 50% of census places. Census places in the best 50% have a value lower than 15.8% while census places in the worst 25% have a value higher than 17.0%.
CA Census Places
The distribution is based on data from 1,472 locales.
Compared to U.S. Census Places, Sleepy Hollow has a value of 15.4% which is in the best 50% of census places. Census places in the best 50% have a value lower than 16.4% while census places in the worst 25% have a value higher than 18.2%.
U.S. Census Places
The distribution is based on data from 27,528 U.S. Census Places.
Compared to the Marin, CA County Value (14.8%), Sleepy Hollow has a value of 15.4% which is higher and worse.
Marin, CA County Value
(14.8%)
The regional value is compared to the Marin County value.
Compared to the US Value (15.5%), Sleepy Hollow has a value of 15.4% which is lower and better.
US Value
(15.5%)
The regional value is compared to the national value.

Adults who Binge Drink Census Place: Stinson Beach

Current Value:

Adults who Binge Drink Census Place: Stinson Beach

14.1%
(2021)
Compared to:
Compared to CA Census Places, Stinson Beach has a value of 14.1% which is in the best 50% of census places. Census places in the best 50% have a value lower than 15.8% while census places in the worst 25% have a value higher than 17.0%.
CA Census Places
The distribution is based on data from 1,472 locales.
Compared to U.S. Census Places, Stinson Beach has a value of 14.1% which is in the best 50% of census places. Census places in the best 50% have a value lower than 16.4% while census places in the worst 25% have a value higher than 18.2%.
U.S. Census Places
The distribution is based on data from 27,528 U.S. Census Places.
Compared to the Marin, CA County Value (14.8%), Stinson Beach has a value of 14.1% which is lower and better.
Marin, CA County Value
(14.8%)
The regional value is compared to the Marin County value.
Compared to the US Value (15.5%), Stinson Beach has a value of 14.1% which is lower and better.
US Value
(15.5%)
The regional value is compared to the national value.

Adults who Binge Drink Census Place: Strawberry

Current Value:

Adults who Binge Drink Census Place: Strawberry

16.1%
(2021)
Compared to:
Compared to CA Census Places, Strawberry has a value of 16.1% which is in the 2nd worst quartile of census places. Census places in the best 50% have a value lower than 15.8% while census places in the worst 25% have a value higher than 17.0%.
CA Census Places
The distribution is based on data from 1,472 locales.
Compared to U.S. Census Places, Strawberry has a value of 16.1% which is in the best 50% of census places. Census places in the best 50% have a value lower than 16.4% while census places in the worst 25% have a value higher than 18.2%.
U.S. Census Places
The distribution is based on data from 27,528 U.S. Census Places.
Compared to the Marin, CA County Value (14.8%), Strawberry has a value of 16.1% which is higher and worse.
Marin, CA County Value
(14.8%)
The regional value is compared to the Marin County value.
Compared to the US Value (15.5%), Strawberry has a value of 16.1% which is higher and worse.
US Value
(15.5%)
The regional value is compared to the national value.

Adults who Binge Drink Census Place: Tamalpais-Homestead Valley

Current Value:
16.4%
(2021)
Compared to:
Compared to CA Census Places, Tamalpais-Homestead Valley has a value of 16.4% which is in the 2nd worst quartile of census places. Census places in the best 50% have a value lower than 15.8% while census places in the worst 25% have a value higher than 17.0%.
CA Census Places
The distribution is based on data from 1,472 locales.
Compared to U.S. Census Places, Tamalpais-Homestead Valley has a value of 16.4% which is in the best 50% of census places. Census places in the best 50% have a value lower than 16.4% while census places in the worst 25% have a value higher than 18.2%.
U.S. Census Places
The distribution is based on data from 27,528 U.S. Census Places.
Compared to the Marin, CA County Value (14.8%), Tamalpais-Homestead Valley has a value of 16.4% which is higher and worse.
Marin, CA County Value
(14.8%)
The regional value is compared to the Marin County value.
Compared to the US Value (15.5%), Tamalpais-Homestead Valley has a value of 16.4% which is higher and worse.
US Value
(15.5%)
The regional value is compared to the national value.

Adults who Binge Drink Census Place: Tiburon

Current Value:

Adults who Binge Drink Census Place: Tiburon

14.4%
(2021)
Compared to:
Compared to CA Census Places, Tiburon has a value of 14.4% which is in the best 50% of census places. Census places in the best 50% have a value lower than 15.8% while census places in the worst 25% have a value higher than 17.0%.
CA Census Places
The distribution is based on data from 1,472 locales.
Compared to U.S. Census Places, Tiburon has a value of 14.4% which is in the best 50% of census places. Census places in the best 50% have a value lower than 16.4% while census places in the worst 25% have a value higher than 18.2%.
U.S. Census Places
The distribution is based on data from 27,528 U.S. Census Places.
Compared to the Marin, CA County Value (14.8%), Tiburon has a value of 14.4% which is lower and better.
Marin, CA County Value
(14.8%)
The regional value is compared to the Marin County value.
Compared to the US Value (15.5%), Tiburon has a value of 14.4% which is lower and better.
US Value
(15.5%)
The regional value is compared to the national value.

Adults who Binge Drink Census Place: Tomales

Current Value:

Adults who Binge Drink Census Place: Tomales

15.9%
(2021)
Compared to:
Compared to CA Census Places, Tomales has a value of 15.9% which is in the 2nd worst quartile of census places. Census places in the best 50% have a value lower than 15.8% while census places in the worst 25% have a value higher than 17.0%.
CA Census Places
The distribution is based on data from 1,472 locales.
Compared to U.S. Census Places, Tomales has a value of 15.9% which is in the best 50% of census places. Census places in the best 50% have a value lower than 16.4% while census places in the worst 25% have a value higher than 18.2%.
U.S. Census Places
The distribution is based on data from 27,528 U.S. Census Places.
Compared to the Marin, CA County Value (14.8%), Tomales has a value of 15.9% which is higher and worse.
Marin, CA County Value
(14.8%)
The regional value is compared to the Marin County value.
Compared to the US Value (15.5%), Tomales has a value of 15.9% which is higher and worse.
US Value
(15.5%)
The regional value is compared to the national value.

Adults who Binge Drink Census Place: Woodacre

Current Value:

Adults who Binge Drink Census Place: Woodacre

15.2%
(2021)
Compared to:
Compared to CA Census Places, Woodacre has a value of 15.2% which is in the best 50% of census places. Census places in the best 50% have a value lower than 15.8% while census places in the worst 25% have a value higher than 17.0%.
CA Census Places
The distribution is based on data from 1,472 locales.
Compared to U.S. Census Places, Woodacre has a value of 15.2% which is in the best 50% of census places. Census places in the best 50% have a value lower than 16.4% while census places in the worst 25% have a value higher than 18.2%.
U.S. Census Places
The distribution is based on data from 27,528 U.S. Census Places.
Compared to the Marin, CA County Value (14.8%), Woodacre has a value of 15.2% which is higher and worse.
Marin, CA County Value
(14.8%)
The regional value is compared to the Marin County value.
Compared to the US Value (15.5%), Woodacre has a value of 15.2% which is lower and better.
US Value
(15.5%)
The regional value is compared to the national value.

Adults who Binge Drink Zip Code: Belvedere, Tiburon (94920)

Current Value:

Adults who Binge Drink Zip Code: Belvedere, Tiburon (94920)

14.2%
(2021)
Compared to:
Compared to CA Zip Codes, Belvedere, Tiburon (94920) has a value of 14.2% which is in the best 50% of zip codes. Zip codes in the best 50% have a value lower than 15.9% while zip codes in the worst 25% have a value higher than 17.1%.
CA Zip Codes
The distribution is based on data from 1,730 California zip codes.
Compared to U.S. Zip Codes, Belvedere, Tiburon (94920) has a value of 14.2% which is in the best 50% of zip codes. Zip codes in the best 50% have a value lower than 16.5% while zip codes in the worst 25% have a value higher than 18.1%.
U.S. Zip Codes
The distribution is based on data from 31,435 U.S. zip codes.
Compared to the Marin, CA County Value (14.8%), Belvedere, Tiburon (94920) has a value of 14.2% which is lower and better.
Marin, CA County Value
(14.8%)
The regional value is compared to the Marin County value.
Compared to the US Value (15.5%), Belvedere, Tiburon (94920) has a value of 14.2% which is lower and better.
US Value
(15.5%)
The regional value is compared to the national value.

Adults who Binge Drink Zip Code: Bolinas (94924)

Current Value:

Adults who Binge Drink Zip Code: Bolinas (94924)

15.7%
(2021)
Compared to:
Compared to CA Zip Codes, Bolinas (94924) has a value of 15.7% which is in the best 50% of zip codes. Zip codes in the best 50% have a value lower than 15.9% while zip codes in the worst 25% have a value higher than 17.1%.
CA Zip Codes
The distribution is based on data from 1,730 California zip codes.
Compared to U.S. Zip Codes, Bolinas (94924) has a value of 15.7% which is in the best 50% of zip codes. Zip codes in the best 50% have a value lower than 16.5% while zip codes in the worst 25% have a value higher than 18.1%.
U.S. Zip Codes
The distribution is based on data from 31,435 U.S. zip codes.
Compared to the Marin, CA County Value (14.8%), Bolinas (94924) has a value of 15.7% which is higher and worse.
Marin, CA County Value
(14.8%)
The regional value is compared to the Marin County value.
Compared to the US Value (15.5%), Bolinas (94924) has a value of 15.7% which is higher and worse.
US Value
(15.5%)
The regional value is compared to the national value.

Adults who Binge Drink Zip Code: Corte Madera (94925)

Current Value:

Adults who Binge Drink Zip Code: Corte Madera (94925)

15.8%
(2021)
Compared to:
Compared to CA Zip Codes, Corte Madera (94925) has a value of 15.8% which is in the best 50% of zip codes. Zip codes in the best 50% have a value lower than 15.9% while zip codes in the worst 25% have a value higher than 17.1%.
CA Zip Codes
The distribution is based on data from 1,730 California zip codes.
Compared to U.S. Zip Codes, Corte Madera (94925) has a value of 15.8% which is in the best 50% of zip codes. Zip codes in the best 50% have a value lower than 16.5% while zip codes in the worst 25% have a value higher than 18.1%.
U.S. Zip Codes
The distribution is based on data from 31,435 U.S. zip codes.
Compared to the Marin, CA County Value (14.8%), Corte Madera (94925) has a value of 15.8% which is higher and worse.
Marin, CA County Value
(14.8%)
The regional value is compared to the Marin County value.
Compared to the US Value (15.5%), Corte Madera (94925) has a value of 15.8% which is higher and worse.
US Value
(15.5%)
The regional value is compared to the national value.

Adults who Binge Drink Zip Code: Dillon Beach (94929)

Current Value:

Adults who Binge Drink Zip Code: Dillon Beach (94929)

13.6%
(2021)
Compared to:
Compared to CA Zip Codes, Dillon Beach (94929) has a value of 13.6% which is in the best 50% of zip codes. Zip codes in the best 50% have a value lower than 15.9% while zip codes in the worst 25% have a value higher than 17.1%.
CA Zip Codes
The distribution is based on data from 1,730 California zip codes.
Compared to U.S. Zip Codes, Dillon Beach (94929) has a value of 13.6% which is in the best 50% of zip codes. Zip codes in the best 50% have a value lower than 16.5% while zip codes in the worst 25% have a value higher than 18.1%.
U.S. Zip Codes
The distribution is based on data from 31,435 U.S. zip codes.
Compared to the Marin, CA County Value (14.8%), Dillon Beach (94929) has a value of 13.6% which is lower and better.
Marin, CA County Value
(14.8%)
The regional value is compared to the Marin County value.
Compared to the US Value (15.5%), Dillon Beach (94929) has a value of 13.6% which is lower and better.
US Value
(15.5%)
The regional value is compared to the national value.

Adults who Binge Drink Zip Code: Fairfax (94930)

Current Value:

Adults who Binge Drink Zip Code: Fairfax (94930)

17.0%
(2021)
Compared to:
Compared to CA Zip Codes, Fairfax (94930) has a value of 17.0% which is in the 2nd worst quartile of zip codes. Zip codes in the best 50% have a value lower than 15.9% while zip codes in the worst 25% have a value higher than 17.1%.
CA Zip Codes
The distribution is based on data from 1,730 California zip codes.
Compared to U.S. Zip Codes, Fairfax (94930) has a value of 17.0% which is in the 2nd worst quartile of zip codes. Zip codes in the best 50% have a value lower than 16.5% while zip codes in the worst 25% have a value higher than 18.1%.
U.S. Zip Codes
The distribution is based on data from 31,435 U.S. zip codes.
Compared to the Marin, CA County Value (14.8%), Fairfax (94930) has a value of 17.0% which is higher and worse.
Marin, CA County Value
(14.8%)
The regional value is compared to the Marin County value.
Compared to the US Value (15.5%), Fairfax (94930) has a value of 17.0% which is higher and worse.
US Value
(15.5%)
The regional value is compared to the national value.

Adults who Binge Drink Zip Code: Forest Knolls (94933)

Current Value:

Adults who Binge Drink Zip Code: Forest Knolls (94933)

16.3%
(2021)
Compared to:
Compared to CA Zip Codes, Forest Knolls (94933) has a value of 16.3% which is in the 2nd worst quartile of zip codes. Zip codes in the best 50% have a value lower than 15.9% while zip codes in the worst 25% have a value higher than 17.1%.
CA Zip Codes
The distribution is based on data from 1,730 California zip codes.
Compared to U.S. Zip Codes, Forest Knolls (94933) has a value of 16.3% which is in the best 50% of zip codes. Zip codes in the best 50% have a value lower than 16.5% while zip codes in the worst 25% have a value higher than 18.1%.
U.S. Zip Codes
The distribution is based on data from 31,435 U.S. zip codes.
Compared to the Marin, CA County Value (14.8%), Forest Knolls (94933) has a value of 16.3% which is higher and worse.
Marin, CA County Value
(14.8%)
The regional value is compared to the Marin County value.
Compared to the US Value (15.5%), Forest Knolls (94933) has a value of 16.3% which is higher and worse.
US Value
(15.5%)
The regional value is compared to the national value.

Adults who Binge Drink Zip Code: Greenbrae, Kentfield (94904)

Current Value:
14.3%
(2021)
Compared to:
Compared to CA Zip Codes, Greenbrae, Kentfield (94904) has a value of 14.3% which is in the best 50% of zip codes. Zip codes in the best 50% have a value lower than 15.9% while zip codes in the worst 25% have a value higher than 17.1%.
CA Zip Codes
The distribution is based on data from 1,730 California zip codes.
Compared to U.S. Zip Codes, Greenbrae, Kentfield (94904) has a value of 14.3% which is in the best 50% of zip codes. Zip codes in the best 50% have a value lower than 16.5% while zip codes in the worst 25% have a value higher than 18.1%.
U.S. Zip Codes
The distribution is based on data from 31,435 U.S. zip codes.
Compared to the Marin, CA County Value (14.8%), Greenbrae, Kentfield (94904) has a value of 14.3% which is lower and better.
Marin, CA County Value
(14.8%)
The regional value is compared to the Marin County value.
Compared to the US Value (15.5%), Greenbrae, Kentfield (94904) has a value of 14.3% which is lower and better.
US Value
(15.5%)
The regional value is compared to the national value.

Adults who Binge Drink Zip Code: Inverness (94937)

Current Value:

Adults who Binge Drink Zip Code: Inverness (94937)

14.1%
(2021)
Compared to:
Compared to CA Zip Codes, Inverness (94937) has a value of 14.1% which is in the best 50% of zip codes. Zip codes in the best 50% have a value lower than 15.9% while zip codes in the worst 25% have a value higher than 17.1%.
CA Zip Codes
The distribution is based on data from 1,730 California zip codes.
Compared to U.S. Zip Codes, Inverness (94937) has a value of 14.1% which is in the best 50% of zip codes. Zip codes in the best 50% have a value lower than 16.5% while zip codes in the worst 25% have a value higher than 18.1%.
U.S. Zip Codes
The distribution is based on data from 31,435 U.S. zip codes.
Compared to the Marin, CA County Value (14.8%), Inverness (94937) has a value of 14.1% which is lower and better.
Marin, CA County Value
(14.8%)
The regional value is compared to the Marin County value.
Compared to the US Value (15.5%), Inverness (94937) has a value of 14.1% which is lower and better.
US Value
(15.5%)
The regional value is compared to the national value.

Adults who Binge Drink Zip Code: Lagunitas (94938)

Current Value:

Adults who Binge Drink Zip Code: Lagunitas (94938)

16.0%
(2021)
Compared to:
Compared to CA Zip Codes, Lagunitas (94938) has a value of 16.0% which is in the 2nd worst quartile of zip codes. Zip codes in the best 50% have a value lower than 15.9% while zip codes in the worst 25% have a value higher than 17.1%.
CA Zip Codes
The distribution is based on data from 1,730 California zip codes.
Compared to U.S. Zip Codes, Lagunitas (94938) has a value of 16.0% which is in the best 50% of zip codes. Zip codes in the best 50% have a value lower than 16.5% while zip codes in the worst 25% have a value higher than 18.1%.
U.S. Zip Codes
The distribution is based on data from 31,435 U.S. zip codes.
Compared to the Marin, CA County Value (14.8%), Lagunitas (94938) has a value of 16.0% which is higher and worse.
Marin, CA County Value
(14.8%)
The regional value is compared to the Marin County value.
Compared to the US Value (15.5%), Lagunitas (94938) has a value of 16.0% which is higher and worse.
US Value
(15.5%)
The regional value is compared to the national value.

Adults who Binge Drink Zip Code: Larkspur (94939)

Current Value:

Adults who Binge Drink Zip Code: Larkspur (94939)

16.0%
(2021)
Compared to:
Compared to CA Zip Codes, Larkspur (94939) has a value of 16.0% which is in the 2nd worst quartile of zip codes. Zip codes in the best 50% have a value lower than 15.9% while zip codes in the worst 25% have a value higher than 17.1%.
CA Zip Codes
The distribution is based on data from 1,730 California zip codes.
Compared to U.S. Zip Codes, Larkspur (94939) has a value of 16.0% which is in the best 50% of zip codes. Zip codes in the best 50% have a value lower than 16.5% while zip codes in the worst 25% have a value higher than 18.1%.
U.S. Zip Codes
The distribution is based on data from 31,435 U.S. zip codes.
Compared to the Marin, CA County Value (14.8%), Larkspur (94939) has a value of 16.0% which is higher and worse.
Marin, CA County Value
(14.8%)
The regional value is compared to the Marin County value.
Compared to the US Value (15.5%), Larkspur (94939) has a value of 16.0% which is higher and worse.
US Value
(15.5%)
The regional value is compared to the national value.

Adults who Binge Drink Zip Code: Marshall (94940)

Current Value:

Adults who Binge Drink Zip Code: Marshall (94940)

15.3%
(2021)
Compared to:
Compared to CA Zip Codes, Marshall (94940) has a value of 15.3% which is in the best 50% of zip codes. Zip codes in the best 50% have a value lower than 15.9% while zip codes in the worst 25% have a value higher than 17.1%.
CA Zip Codes
The distribution is based on data from 1,730 California zip codes.
Compared to U.S. Zip Codes, Marshall (94940) has a value of 15.3% which is in the best 50% of zip codes. Zip codes in the best 50% have a value lower than 16.5% while zip codes in the worst 25% have a value higher than 18.1%.
U.S. Zip Codes
The distribution is based on data from 31,435 U.S. zip codes.
Compared to the Marin, CA County Value (14.8%), Marshall (94940) has a value of 15.3% which is higher and worse.
Marin, CA County Value
(14.8%)
The regional value is compared to the Marin County value.
Compared to the US Value (15.5%), Marshall (94940) has a value of 15.3% which is lower and better.
US Value
(15.5%)
The regional value is compared to the national value.

Adults who Binge Drink Zip Code: Mill Valley (94941)

Current Value:

Adults who Binge Drink Zip Code: Mill Valley (94941)

15.9%
(2021)
Compared to:
Compared to CA Zip Codes, Mill Valley (94941) has a value of 15.9% which is in the best 50% of zip codes. Zip codes in the best 50% have a value lower than 15.9% while zip codes in the worst 25% have a value higher than 17.1%.
CA Zip Codes
The distribution is based on data from 1,730 California zip codes.
Compared to U.S. Zip Codes, Mill Valley (94941) has a value of 15.9% which is in the best 50% of zip codes. Zip codes in the best 50% have a value lower than 16.5% while zip codes in the worst 25% have a value higher than 18.1%.
U.S. Zip Codes
The distribution is based on data from 31,435 U.S. zip codes.
Compared to the Marin, CA County Value (14.8%), Mill Valley (94941) has a value of 15.9% which is higher and worse.
Marin, CA County Value
(14.8%)
The regional value is compared to the Marin County value.
Compared to the US Value (15.5%), Mill Valley (94941) has a value of 15.9% which is higher and worse.
US Value
(15.5%)
The regional value is compared to the national value.

Adults who Binge Drink Zip Code: Muir Beach, Sausalito (94965)

Current Value:
15.7%
(2021)
Compared to:
Compared to CA Zip Codes, Muir Beach, Sausalito (94965) has a value of 15.7% which is in the best 50% of zip codes. Zip codes in the best 50% have a value lower than 15.9% while zip codes in the worst 25% have a value higher than 17.1%.
CA Zip Codes
The distribution is based on data from 1,730 California zip codes.
Compared to U.S. Zip Codes, Muir Beach, Sausalito (94965) has a value of 15.7% which is in the best 50% of zip codes. Zip codes in the best 50% have a value lower than 16.5% while zip codes in the worst 25% have a value higher than 18.1%.
U.S. Zip Codes
The distribution is based on data from 31,435 U.S. zip codes.
Compared to the Marin, CA County Value (14.8%), Muir Beach, Sausalito (94965) has a value of 15.7% which is higher and worse.
Marin, CA County Value
(14.8%)
The regional value is compared to the Marin County value.
Compared to the US Value (15.5%), Muir Beach, Sausalito (94965) has a value of 15.7% which is higher and worse.
US Value
(15.5%)
The regional value is compared to the national value.

Adults who Binge Drink Zip Code: Nicasio (94946)

Current Value:

Adults who Binge Drink Zip Code: Nicasio (94946)

16.4%
(2021)
Compared to:
Compared to CA Zip Codes, Nicasio (94946) has a value of 16.4% which is in the 2nd worst quartile of zip codes. Zip codes in the best 50% have a value lower than 15.9% while zip codes in the worst 25% have a value higher than 17.1%.
CA Zip Codes
The distribution is based on data from 1,730 California zip codes.
Compared to U.S. Zip Codes, Nicasio (94946) has a value of 16.4% which is in the best 50% of zip codes. Zip codes in the best 50% have a value lower than 16.5% while zip codes in the worst 25% have a value higher than 18.1%.
U.S. Zip Codes
The distribution is based on data from 31,435 U.S. zip codes.
Compared to the Marin, CA County Value (14.8%), Nicasio (94946) has a value of 16.4% which is higher and worse.
Marin, CA County Value
(14.8%)
The regional value is compared to the Marin County value.
Compared to the US Value (15.5%), Nicasio (94946) has a value of 16.4% which is higher and worse.
US Value
(15.5%)
The regional value is compared to the national value.

Adults who Binge Drink Zip Code: Novato (94945)

Current Value:

Adults who Binge Drink Zip Code: Novato (94945)

15.9%
(2021)
Compared to:
Compared to CA Zip Codes, Novato (94945) has a value of 15.9% which is in the best 50% of zip codes. Zip codes in the best 50% have a value lower than 15.9% while zip codes in the worst 25% have a value higher than 17.1%.
CA Zip Codes
The distribution is based on data from 1,730 California zip codes.
Compared to U.S. Zip Codes, Novato (94945) has a value of 15.9% which is in the best 50% of zip codes. Zip codes in the best 50% have a value lower than 16.5% while zip codes in the worst 25% have a value higher than 18.1%.
U.S. Zip Codes
The distribution is based on data from 31,435 U.S. zip codes.
Compared to the Marin, CA County Value (14.8%), Novato (94945) has a value of 15.9% which is higher and worse.
Marin, CA County Value
(14.8%)
The regional value is compared to the Marin County value.
Compared to the US Value (15.5%), Novato (94945) has a value of 15.9% which is higher and worse.
US Value
(15.5%)
The regional value is compared to the national value.

Adults who Binge Drink Zip Code: Novato (94947)

Current Value:

Adults who Binge Drink Zip Code: Novato (94947)

15.9%
(2021)
Compared to:
Compared to CA Zip Codes, Novato (94947) has a value of 15.9% which is in the best 50% of zip codes. Zip codes in the best 50% have a value lower than 15.9% while zip codes in the worst 25% have a value higher than 17.1%.
CA Zip Codes
The distribution is based on data from 1,730 California zip codes.
Compared to U.S. Zip Codes, Novato (94947) has a value of 15.9% which is in the best 50% of zip codes. Zip codes in the best 50% have a value lower than 16.5% while zip codes in the worst 25% have a value higher than 18.1%.
U.S. Zip Codes
The distribution is based on data from 31,435 U.S. zip codes.
Compared to the Marin, CA County Value (14.8%), Novato (94947) has a value of 15.9% which is higher and worse.
Marin, CA County Value
(14.8%)
The regional value is compared to the Marin County value.
Compared to the US Value (15.5%), Novato (94947) has a value of 15.9% which is higher and worse.
US Value
(15.5%)
The regional value is compared to the national value.

Adults who Binge Drink Zip Code: Novato (94949)

Current Value:

Adults who Binge Drink Zip Code: Novato (94949)

16.2%
(2021)
Compared to:
Compared to CA Zip Codes, Novato (94949) has a value of 16.2% which is in the 2nd worst quartile of zip codes. Zip codes in the best 50% have a value lower than 15.9% while zip codes in the worst 25% have a value higher than 17.1%.
CA Zip Codes
The distribution is based on data from 1,730 California zip codes.
Compared to U.S. Zip Codes, Novato (94949) has a value of 16.2% which is in the best 50% of zip codes. Zip codes in the best 50% have a value lower than 16.5% while zip codes in the worst 25% have a value higher than 18.1%.
U.S. Zip Codes
The distribution is based on data from 31,435 U.S. zip codes.
Compared to the Marin, CA County Value (14.8%), Novato (94949) has a value of 16.2% which is higher and worse.
Marin, CA County Value
(14.8%)
The regional value is compared to the Marin County value.
Compared to the US Value (15.5%), Novato (94949) has a value of 16.2% which is higher and worse.
US Value
(15.5%)
The regional value is compared to the national value.

Adults who Binge Drink Zip Code: Olema (94950)

Current Value:

Adults who Binge Drink Zip Code: Olema (94950)

15.8%
(2021)
Compared to:
Compared to CA Zip Codes, Olema (94950) has a value of 15.8% which is in the best 50% of zip codes. Zip codes in the best 50% have a value lower than 15.9% while zip codes in the worst 25% have a value higher than 17.1%.
CA Zip Codes
The distribution is based on data from 1,730 California zip codes.
Compared to U.S. Zip Codes, Olema (94950) has a value of 15.8% which is in the best 50% of zip codes. Zip codes in the best 50% have a value lower than 16.5% while zip codes in the worst 25% have a value higher than 18.1%.
U.S. Zip Codes
The distribution is based on data from 31,435 U.S. zip codes.
Compared to the Marin, CA County Value (14.8%), Olema (94950) has a value of 15.8% which is higher and worse.
Marin, CA County Value
(14.8%)
The regional value is compared to the Marin County value.
Compared to the US Value (15.5%), Olema (94950) has a value of 15.8% which is higher and worse.
US Value
(15.5%)
The regional value is compared to the national value.

Adults who Binge Drink Zip Code: Point Reyes Station (94956)

Current Value:

Adults who Binge Drink Zip Code: Point Reyes Station (94956)

14.6%
(2021)
Compared to:
Compared to CA Zip Codes, Point Reyes Station (94956) has a value of 14.6% which is in the best 50% of zip codes. Zip codes in the best 50% have a value lower than 15.9% while zip codes in the worst 25% have a value higher than 17.1%.
CA Zip Codes
The distribution is based on data from 1,730 California zip codes.
Compared to U.S. Zip Codes, Point Reyes Station (94956) has a value of 14.6% which is in the best 50% of zip codes. Zip codes in the best 50% have a value lower than 16.5% while zip codes in the worst 25% have a value higher than 18.1%.
U.S. Zip Codes
The distribution is based on data from 31,435 U.S. zip codes.
Compared to the Marin, CA County Value (14.8%), Point Reyes Station (94956) has a value of 14.6% which is lower and better.
Marin, CA County Value
(14.8%)
The regional value is compared to the Marin County value.
Compared to the US Value (15.5%), Point Reyes Station (94956) has a value of 14.6% which is lower and better.
US Value
(15.5%)
The regional value is compared to the national value.

Adults who Binge Drink Zip Code: Ross (94957)

Current Value:

Adults who Binge Drink Zip Code: Ross (94957)

15.0%
(2021)
Compared to:
Compared to CA Zip Codes, Ross (94957) has a value of 15.0% which is in the best 50% of zip codes. Zip codes in the best 50% have a value lower than 15.9% while zip codes in the worst 25% have a value higher than 17.1%.
CA Zip Codes
The distribution is based on data from 1,730 California zip codes.
Compared to U.S. Zip Codes, Ross (94957) has a value of 15.0% which is in the best 50% of zip codes. Zip codes in the best 50% have a value lower than 16.5% while zip codes in the worst 25% have a value higher than 18.1%.
U.S. Zip Codes
The distribution is based on data from 31,435 U.S. zip codes.
Compared to the Marin, CA County Value (14.8%), Ross (94957) has a value of 15.0% which is higher and worse.
Marin, CA County Value
(14.8%)
The regional value is compared to the Marin County value.
Compared to the US Value (15.5%), Ross (94957) has a value of 15.0% which is lower and better.
US Value
(15.5%)
The regional value is compared to the national value.

Adults who Binge Drink Zip Code: San Anselmo (94960)

Current Value:

Adults who Binge Drink Zip Code: San Anselmo (94960)

16.6%
(2021)
Compared to:
Compared to CA Zip Codes, San Anselmo (94960) has a value of 16.6% which is in the 2nd worst quartile of zip codes. Zip codes in the best 50% have a value lower than 15.9% while zip codes in the worst 25% have a value higher than 17.1%.
CA Zip Codes
The distribution is based on data from 1,730 California zip codes.
Compared to U.S. Zip Codes, San Anselmo (94960) has a value of 16.6% which is in the 2nd worst quartile of zip codes. Zip codes in the best 50% have a value lower than 16.5% while zip codes in the worst 25% have a value higher than 18.1%.
U.S. Zip Codes
The distribution is based on data from 31,435 U.S. zip codes.
Compared to the Marin, CA County Value (14.8%), San Anselmo (94960) has a value of 16.6% which is higher and worse.
Marin, CA County Value
(14.8%)
The regional value is compared to the Marin County value.
Compared to the US Value (15.5%), San Anselmo (94960) has a value of 16.6% which is higher and worse.
US Value
(15.5%)
The regional value is compared to the national value.

Adults who Binge Drink Zip Code: San Geronimo (94963)

Current Value:

Adults who Binge Drink Zip Code: San Geronimo (94963)

15.1%
(2021)
Compared to:
Compared to CA Zip Codes, San Geronimo (94963) has a value of 15.1% which is in the best 50% of zip codes. Zip codes in the best 50% have a value lower than 15.9% while zip codes in the worst 25% have a value higher than 17.1%.
CA Zip Codes
The distribution is based on data from 1,730 California zip codes.
Compared to U.S. Zip Codes, San Geronimo (94963) has a value of 15.1% which is in the best 50% of zip codes. Zip codes in the best 50% have a value lower than 16.5% while zip codes in the worst 25% have a value higher than 18.1%.
U.S. Zip Codes
The distribution is based on data from 31,435 U.S. zip codes.
Compared to the Marin, CA County Value (14.8%), San Geronimo (94963) has a value of 15.1% which is higher and worse.
Marin, CA County Value
(14.8%)
The regional value is compared to the Marin County value.
Compared to the US Value (15.5%), San Geronimo (94963) has a value of 15.1% which is lower and better.
US Value
(15.5%)
The regional value is compared to the national value.

Adults who Binge Drink Zip Code: San Quentin (94964)

Current Value:

Adults who Binge Drink Zip Code: San Quentin (94964)

22.4%
(2021)
Compared to:
Compared to CA Zip Codes, San Quentin (94964) has a value of 22.4% which is in the worst 25% of zip codes. Zip codes in the best 50% have a value lower than 15.9% while zip codes in the worst 25% have a value higher than 17.1%.
CA Zip Codes
The distribution is based on data from 1,730 California zip codes.
Compared to U.S. Zip Codes, San Quentin (94964) has a value of 22.4% which is in the worst 25% of zip codes. Zip codes in the best 50% have a value lower than 16.5% while zip codes in the worst 25% have a value higher than 18.1%.
U.S. Zip Codes
The distribution is based on data from 31,435 U.S. zip codes.
Compared to the Marin, CA County Value (14.8%), San Quentin (94964) has a value of 22.4% which is higher and worse.
Marin, CA County Value
(14.8%)
The regional value is compared to the Marin County value.
Compared to the US Value (15.5%), San Quentin (94964) has a value of 22.4% which is higher and worse.
US Value
(15.5%)
The regional value is compared to the national value.

Adults who Binge Drink Zip Code: San Rafael (94901)

Current Value:

Adults who Binge Drink Zip Code: San Rafael (94901)

16.5%
(2021)
Compared to:
Compared to CA Zip Codes, San Rafael (94901) has a value of 16.5% which is in the 2nd worst quartile of zip codes. Zip codes in the best 50% have a value lower than 15.9% while zip codes in the worst 25% have a value higher than 17.1%.
CA Zip Codes
The distribution is based on data from 1,730 California zip codes.
Compared to U.S. Zip Codes, San Rafael (94901) has a value of 16.5% which is in the best 50% of zip codes. Zip codes in the best 50% have a value lower than 16.5% while zip codes in the worst 25% have a value higher than 18.1%.
U.S. Zip Codes
The distribution is based on data from 31,435 U.S. zip codes.
Compared to the Marin, CA County Value (14.8%), San Rafael (94901) has a value of 16.5% which is higher and worse.
Marin, CA County Value
(14.8%)
The regional value is compared to the Marin County value.
Compared to the US Value (15.5%), San Rafael (94901) has a value of 16.5% which is higher and worse.
US Value
(15.5%)
The regional value is compared to the national value.

Adults who Binge Drink Zip Code: San Rafael (94903)

Current Value:

Adults who Binge Drink Zip Code: San Rafael (94903)

14.8%
(2021)
Compared to:
Compared to CA Zip Codes, San Rafael (94903) has a value of 14.8% which is in the best 50% of zip codes. Zip codes in the best 50% have a value lower than 15.9% while zip codes in the worst 25% have a value higher than 17.1%.
CA Zip Codes
The distribution is based on data from 1,730 California zip codes.
Compared to U.S. Zip Codes, San Rafael (94903) has a value of 14.8% which is in the best 50% of zip codes. Zip codes in the best 50% have a value lower than 16.5% while zip codes in the worst 25% have a value higher than 18.1%.
U.S. Zip Codes
The distribution is based on data from 31,435 U.S. zip codes.
Compared to the Marin, CA County Value (14.8%), San Rafael (94903) has a value of 14.8%.
Marin, CA County Value
(14.8%)
The regional value is compared to the Marin County value.
Compared to the US Value (15.5%), San Rafael (94903) has a value of 14.8% which is lower and better.
US Value
(15.5%)
The regional value is compared to the national value.

Adults who Binge Drink Zip Code: Stinson Beach (94970)

Current Value:

Adults who Binge Drink Zip Code: Stinson Beach (94970)

13.9%
(2021)
Compared to:
Compared to CA Zip Codes, Stinson Beach (94970) has a value of 13.9% which is in the best 50% of zip codes. Zip codes in the best 50% have a value lower than 15.9% while zip codes in the worst 25% have a value higher than 17.1%.
CA Zip Codes
The distribution is based on data from 1,730 California zip codes.
Compared to U.S. Zip Codes, Stinson Beach (94970) has a value of 13.9% which is in the best 50% of zip codes. Zip codes in the best 50% have a value lower than 16.5% while zip codes in the worst 25% have a value higher than 18.1%.
U.S. Zip Codes
The distribution is based on data from 31,435 U.S. zip codes.
Compared to the Marin, CA County Value (14.8%), Stinson Beach (94970) has a value of 13.9% which is lower and better.
Marin, CA County Value
(14.8%)
The regional value is compared to the Marin County value.
Compared to the US Value (15.5%), Stinson Beach (94970) has a value of 13.9% which is lower and better.
US Value
(15.5%)
The regional value is compared to the national value.

Adults who Binge Drink Zip Code: Tomales (94971)

Current Value:

Adults who Binge Drink Zip Code: Tomales (94971)

15.6%
(2021)
Compared to:
Compared to CA Zip Codes, Tomales (94971) has a value of 15.6% which is in the best 50% of zip codes. Zip codes in the best 50% have a value lower than 15.9% while zip codes in the worst 25% have a value higher than 17.1%.
CA Zip Codes
The distribution is based on data from 1,730 California zip codes.
Compared to U.S. Zip Codes, Tomales (94971) has a value of 15.6% which is in the best 50% of zip codes. Zip codes in the best 50% have a value lower than 16.5% while zip codes in the worst 25% have a value higher than 18.1%.
U.S. Zip Codes
The distribution is based on data from 31,435 U.S. zip codes.
Compared to the Marin, CA County Value (14.8%), Tomales (94971) has a value of 15.6% which is higher and worse.
Marin, CA County Value
(14.8%)
The regional value is compared to the Marin County value.
Compared to the US Value (15.5%), Tomales (94971) has a value of 15.6% which is higher and worse.
US Value
(15.5%)
The regional value is compared to the national value.

Adults who Binge Drink Zip Code: Woodacre (94973)

Current Value:

Adults who Binge Drink Zip Code: Woodacre (94973)

15.3%
(2021)
Compared to:
Compared to CA Zip Codes, Woodacre (94973) has a value of 15.3% which is in the best 50% of zip codes. Zip codes in the best 50% have a value lower than 15.9% while zip codes in the worst 25% have a value higher than 17.1%.
CA Zip Codes
The distribution is based on data from 1,730 California zip codes.
Compared to U.S. Zip Codes, Woodacre (94973) has a value of 15.3% which is in the best 50% of zip codes. Zip codes in the best 50% have a value lower than 16.5% while zip codes in the worst 25% have a value higher than 18.1%.
U.S. Zip Codes
The distribution is based on data from 31,435 U.S. zip codes.
Compared to the Marin, CA County Value (14.8%), Woodacre (94973) has a value of 15.3% which is higher and worse.
Marin, CA County Value
(14.8%)
The regional value is compared to the Marin County value.
Compared to the US Value (15.5%), Woodacre (94973) has a value of 15.3% which is lower and better.
US Value
(15.5%)
The regional value is compared to the national value.

Adults who Binge Drink Census Tract: 06041101100

Current Value:

Adults who Binge Drink Census Tract: 06041101100

15.4%
(2021)
Compared to:
Compared to CA Census Tracts, 06041101100 has a value of 15.4% which is in the best 50% of census tracts. Census tracts in the best 50% have a value lower than 15.9% while census tracts in the worst 25% have a value higher than 17.2%.
CA Census Tracts
The distribution is based on data from 8,005 California census tracts.
Compared to U.S. Census Tracts, 06041101100 has a value of 15.4% which is in the best 50% of census tracts. Census tracts in the best 50% have a value lower than 16.5% while census tracts in the worst 25% have a value higher than 18.3%.
U.S. Census Tracts
The distribution is based on data from 68,167 U.S. census tracts.
Compared to the Marin, CA County Value (14.8%), 06041101100 has a value of 15.4% which is higher and worse.
Marin, CA County Value
(14.8%)
The regional value is compared to the Marin County value.
Compared to the US Value (15.5%), 06041101100 has a value of 15.4% which is lower and better.
US Value
(15.5%)
The regional value is compared to the national value.

Adults who Binge Drink Census Tract: 06041101200

Current Value:

Adults who Binge Drink Census Tract: 06041101200

16.3%
(2021)
Compared to:
Compared to CA Census Tracts, 06041101200 has a value of 16.3% which is in the 2nd worst quartile of census tracts. Census tracts in the best 50% have a value lower than 15.9% while census tracts in the worst 25% have a value higher than 17.2%.
CA Census Tracts
The distribution is based on data from 8,005 California census tracts.
Compared to U.S. Census Tracts, 06041101200 has a value of 16.3% which is in the best 50% of census tracts. Census tracts in the best 50% have a value lower than 16.5% while census tracts in the worst 25% have a value higher than 18.3%.
U.S. Census Tracts
The distribution is based on data from 68,167 U.S. census tracts.
Compared to the Marin, CA County Value (14.8%), 06041101200 has a value of 16.3% which is higher and worse.
Marin, CA County Value
(14.8%)
The regional value is compared to the Marin County value.
Compared to the US Value (15.5%), 06041101200 has a value of 16.3% which is higher and worse.
US Value
(15.5%)
The regional value is compared to the national value.

Adults who Binge Drink Census Tract: 06041102100

Current Value:

Adults who Binge Drink Census Tract: 06041102100

15.5%
(2021)
Compared to:
Compared to CA Census Tracts, 06041102100 has a value of 15.5% which is in the best 50% of census tracts. Census tracts in the best 50% have a value lower than 15.9% while census tracts in the worst 25% have a value higher than 17.2%.
CA Census Tracts
The distribution is based on data from 8,005 California census tracts.
Compared to U.S. Census Tracts, 06041102100 has a value of 15.5% which is in the best 50% of census tracts. Census tracts in the best 50% have a value lower than 16.5% while census tracts in the worst 25% have a value higher than 18.3%.
U.S. Census Tracts
The distribution is based on data from 68,167 U.S. census tracts.
Compared to the Marin, CA County Value (14.8%), 06041102100 has a value of 15.5% which is higher and worse.
Marin, CA County Value
(14.8%)
The regional value is compared to the Marin County value.
Compared to the US Value (15.5%), 06041102100 has a value of 15.5%.
US Value
(15.5%)
The regional value is compared to the national value.

Adults who Binge Drink Census Tract: 06041102202

Current Value:

Adults who Binge Drink Census Tract: 06041102202

16.4%
(2021)
Compared to:
Compared to CA Census Tracts, 06041102202 has a value of 16.4% which is in the 2nd worst quartile of census tracts. Census tracts in the best 50% have a value lower than 15.9% while census tracts in the worst 25% have a value higher than 17.2%.
CA Census Tracts
The distribution is based on data from 8,005 California census tracts.
Compared to U.S. Census Tracts, 06041102202 has a value of 16.4% which is in the best 50% of census tracts. Census tracts in the best 50% have a value lower than 16.5% while census tracts in the worst 25% have a value higher than 18.3%.
U.S. Census Tracts
The distribution is based on data from 68,167 U.S. census tracts.
Compared to the Marin, CA County Value (14.8%), 06041102202 has a value of 16.4% which is higher and worse.
Marin, CA County Value
(14.8%)
The regional value is compared to the Marin County value.
Compared to the US Value (15.5%), 06041102202 has a value of 16.4% which is higher and worse.
US Value
(15.5%)
The regional value is compared to the national value.

Adults who Binge Drink Census Tract: 06041102203

Current Value:

Adults who Binge Drink Census Tract: 06041102203

15.9%
(2021)
Compared to:
Compared to CA Census Tracts, 06041102203 has a value of 15.9% which is in the best 50% of census tracts. Census tracts in the best 50% have a value lower than 15.9% while census tracts in the worst 25% have a value higher than 17.2%.
CA Census Tracts
The distribution is based on data from 8,005 California census tracts.
Compared to U.S. Census Tracts, 06041102203 has a value of 15.9% which is in the best 50% of census tracts. Census tracts in the best 50% have a value lower than 16.5% while census tracts in the worst 25% have a value higher than 18.3%.
U.S. Census Tracts
The distribution is based on data from 68,167 U.S. census tracts.
Compared to the Marin, CA County Value (14.8%), 06041102203 has a value of 15.9% which is higher and worse.
Marin, CA County Value
(14.8%)
The regional value is compared to the Marin County value.
Compared to the US Value (15.5%), 06041102203 has a value of 15.9% which is higher and worse.
US Value
(15.5%)
The regional value is compared to the national value.

Adults who Binge Drink Census Tract: 06041103100

Current Value:

Adults who Binge Drink Census Tract: 06041103100

16.2%
(2021)
Compared to:
Compared to CA Census Tracts, 06041103100 has a value of 16.2% which is in the 2nd worst quartile of census tracts. Census tracts in the best 50% have a value lower than 15.9% while census tracts in the worst 25% have a value higher than 17.2%.
CA Census Tracts
The distribution is based on data from 8,005 California census tracts.
Compared to U.S. Census Tracts, 06041103100 has a value of 16.2% which is in the best 50% of census tracts. Census tracts in the best 50% have a value lower than 16.5% while census tracts in the worst 25% have a value higher than 18.3%.
U.S. Census Tracts
The distribution is based on data from 68,167 U.S. census tracts.
Compared to the Marin, CA County Value (14.8%), 06041103100 has a value of 16.2% which is higher and worse.
Marin, CA County Value
(14.8%)
The regional value is compared to the Marin County value.
Compared to the US Value (15.5%), 06041103100 has a value of 16.2% which is higher and worse.
US Value
(15.5%)
The regional value is compared to the national value.

Adults who Binge Drink Census Tract: 06041103200

Current Value:

Adults who Binge Drink Census Tract: 06041103200

15.0%
(2021)
Compared to:
Compared to CA Census Tracts, 06041103200 has a value of 15.0% which is in the best 50% of census tracts. Census tracts in the best 50% have a value lower than 15.9% while census tracts in the worst 25% have a value higher than 17.2%.
CA Census Tracts
The distribution is based on data from 8,005 California census tracts.
Compared to U.S. Census Tracts, 06041103200 has a value of 15.0% which is in the best 50% of census tracts. Census tracts in the best 50% have a value lower than 16.5% while census tracts in the worst 25% have a value higher than 18.3%.
U.S. Census Tracts
The distribution is based on data from 68,167 U.S. census tracts.
Compared to the Marin, CA County Value (14.8%), 06041103200 has a value of 15.0% which is higher and worse.
Marin, CA County Value
(14.8%)
The regional value is compared to the Marin County value.
Compared to the US Value (15.5%), 06041103200 has a value of 15.0% which is lower and better.
US Value
(15.5%)
The regional value is compared to the national value.

Adults who Binge Drink Census Tract: 06041104101

Current Value:

Adults who Binge Drink Census Tract: 06041104101

15.9%
(2021)
Compared to:
Compared to CA Census Tracts, 06041104101 has a value of 15.9% which is in the best 50% of census tracts. Census tracts in the best 50% have a value lower than 15.9% while census tracts in the worst 25% have a value higher than 17.2%.
CA Census Tracts
The distribution is based on data from 8,005 California census tracts.
Compared to U.S. Census Tracts, 06041104101 has a value of 15.9% which is in the best 50% of census tracts. Census tracts in the best 50% have a value lower than 16.5% while census tracts in the worst 25% have a value higher than 18.3%.
U.S. Census Tracts
The distribution is based on data from 68,167 U.S. census tracts.
Compared to the Marin, CA County Value (14.8%), 06041104101 has a value of 15.9% which is higher and worse.
Marin, CA County Value
(14.8%)
The regional value is compared to the Marin County value.
Compared to the US Value (15.5%), 06041104101 has a value of 15.9% which is higher and worse.
US Value
(15.5%)
The regional value is compared to the national value.

Adults who Binge Drink Census Tract: 06041104102

Current Value:

Adults who Binge Drink Census Tract: 06041104102

17.2%
(2021)
Compared to:
Compared to CA Census Tracts, 06041104102 has a value of 17.2% which is in the worst 25% of census tracts. Census tracts in the best 50% have a value lower than 15.9% while census tracts in the worst 25% have a value higher than 17.2%.
CA Census Tracts
The distribution is based on data from 8,005 California census tracts.
Compared to U.S. Census Tracts, 06041104102 has a value of 17.2% which is in the 2nd worst quartile of census tracts. Census tracts in the best 50% have a value lower than 16.5% while census tracts in the worst 25% have a value higher than 18.3%.
U.S. Census Tracts
The distribution is based on data from 68,167 U.S. census tracts.
Compared to the Marin, CA County Value (14.8%), 06041104102 has a value of 17.2% which is higher and worse.
Marin, CA County Value
(14.8%)
The regional value is compared to the Marin County value.
Compared to the US Value (15.5%), 06041104102 has a value of 17.2% which is higher and worse.
US Value
(15.5%)
The regional value is compared to the national value.

Adults who Binge Drink Census Tract: 06041104200

Current Value:

Adults who Binge Drink Census Tract: 06041104200

15.5%
(2021)
Compared to:
Compared to CA Census Tracts, 06041104200 has a value of 15.5% which is in the best 50% of census tracts. Census tracts in the best 50% have a value lower than 15.9% while census tracts in the worst 25% have a value higher than 17.2%.
CA Census Tracts
The distribution is based on data from 8,005 California census tracts.
Compared to U.S. Census Tracts, 06041104200 has a value of 15.5% which is in the best 50% of census tracts. Census tracts in the best 50% have a value lower than 16.5% while census tracts in the worst 25% have a value higher than 18.3%.
U.S. Census Tracts
The distribution is based on data from 68,167 U.S. census tracts.
Compared to the Marin, CA County Value (14.8%), 06041104200 has a value of 15.5% which is higher and worse.
Marin, CA County Value
(14.8%)
The regional value is compared to the Marin County value.
Compared to the US Value (15.5%), 06041104200 has a value of 15.5%.
US Value
(15.5%)
The regional value is compared to the national value.

Adults who Binge Drink Census Tract: 06041104300

Current Value:

Adults who Binge Drink Census Tract: 06041104300

14.7%
(2021)
Compared to:
Compared to CA Census Tracts, 06041104300 has a value of 14.7% which is in the best 50% of census tracts. Census tracts in the best 50% have a value lower than 15.9% while census tracts in the worst 25% have a value higher than 17.2%.
CA Census Tracts
The distribution is based on data from 8,005 California census tracts.
Compared to U.S. Census Tracts, 06041104300 has a value of 14.7% which is in the best 50% of census tracts. Census tracts in the best 50% have a value lower than 16.5% while census tracts in the worst 25% have a value higher than 18.3%.
U.S. Census Tracts
The distribution is based on data from 68,167 U.S. census tracts.
Compared to the Marin, CA County Value (14.8%), 06041104300 has a value of 14.7% which is lower and better.
Marin, CA County Value
(14.8%)
The regional value is compared to the Marin County value.
Compared to the US Value (15.5%), 06041104300 has a value of 14.7% which is lower and better.
US Value
(15.5%)
The regional value is compared to the national value.

Adults who Binge Drink Census Tract: 06041105000

Current Value:

Adults who Binge Drink Census Tract: 06041105000

16.9%
(2021)
Compared to:
Compared to CA Census Tracts, 06041105000 has a value of 16.9% which is in the 2nd worst quartile of census tracts. Census tracts in the best 50% have a value lower than 15.9% while census tracts in the worst 25% have a value higher than 17.2%.
CA Census Tracts
The distribution is based on data from 8,005 California census tracts.
Compared to U.S. Census Tracts, 06041105000 has a value of 16.9% which is in the 2nd worst quartile of census tracts. Census tracts in the best 50% have a value lower than 16.5% while census tracts in the worst 25% have a value higher than 18.3%.
U.S. Census Tracts
The distribution is based on data from 68,167 U.S. census tracts.
Compared to the Marin, CA County Value (14.8%), 06041105000 has a value of 16.9% which is higher and worse.
Marin, CA County Value
(14.8%)
The regional value is compared to the Marin County value.
Compared to the US Value (15.5%), 06041105000 has a value of 16.9% which is higher and worse.
US Value
(15.5%)
The regional value is compared to the national value.

Adults who Binge Drink Census Tract: 06041106001

Current Value:

Adults who Binge Drink Census Tract: 06041106001

16.0%
(2021)
Compared to:
Compared to CA Census Tracts, 06041106001 has a value of 16.0% which is in the 2nd worst quartile of census tracts. Census tracts in the best 50% have a value lower than 15.9% while census tracts in the worst 25% have a value higher than 17.2%.
CA Census Tracts
The distribution is based on data from 8,005 California census tracts.
Compared to U.S. Census Tracts, 06041106001 has a value of 16.0% which is in the best 50% of census tracts. Census tracts in the best 50% have a value lower than 16.5% while census tracts in the worst 25% have a value higher than 18.3%.
U.S. Census Tracts
The distribution is based on data from 68,167 U.S. census tracts.
Compared to the Marin, CA County Value (14.8%), 06041106001 has a value of 16.0% which is higher and worse.
Marin, CA County Value
(14.8%)
The regional value is compared to the Marin County value.
Compared to the US Value (15.5%), 06041106001 has a value of 16.0% which is higher and worse.
US Value
(15.5%)
The regional value is compared to the national value.

Adults who Binge Drink Census Tract: 06041106002

Current Value:

Adults who Binge Drink Census Tract: 06041106002

16.2%
(2021)
Compared to:
Compared to CA Census Tracts, 06041106002 has a value of 16.2% which is in the 2nd worst quartile of census tracts. Census tracts in the best 50% have a value lower than 15.9% while census tracts in the worst 25% have a value higher than 17.2%.
CA Census Tracts
The distribution is based on data from 8,005 California census tracts.
Compared to U.S. Census Tracts, 06041106002 has a value of 16.2% which is in the best 50% of census tracts. Census tracts in the best 50% have a value lower than 16.5% while census tracts in the worst 25% have a value higher than 18.3%.
U.S. Census Tracts
The distribution is based on data from 68,167 U.S. census tracts.
Compared to the Marin, CA County Value (14.8%), 06041106002 has a value of 16.2% which is higher and worse.
Marin, CA County Value
(14.8%)
The regional value is compared to the Marin County value.
Compared to the US Value (15.5%), 06041106002 has a value of 16.2% which is higher and worse.
US Value
(15.5%)
The regional value is compared to the national value.

Adults who Binge Drink Census Tract: 06041107000

Current Value:

Adults who Binge Drink Census Tract: 06041107000

14.7%
(2021)
Compared to:
Compared to CA Census Tracts, 06041107000 has a value of 14.7% which is in the best 50% of census tracts. Census tracts in the best 50% have a value lower than 15.9% while census tracts in the worst 25% have a value higher than 17.2%.
CA Census Tracts
The distribution is based on data from 8,005 California census tracts.
Compared to U.S. Census Tracts, 06041107000 has a value of 14.7% which is in the best 50% of census tracts. Census tracts in the best 50% have a value lower than 16.5% while census tracts in the worst 25% have a value higher than 18.3%.
U.S. Census Tracts
The distribution is based on data from 68,167 U.S. census tracts.
Compared to the Marin, CA County Value (14.8%), 06041107000 has a value of 14.7% which is lower and better.
Marin, CA County Value
(14.8%)
The regional value is compared to the Marin County value.
Compared to the US Value (15.5%), 06041107000 has a value of 14.7% which is lower and better.
US Value
(15.5%)
The regional value is compared to the national value.

Adults who Binge Drink Census Tract: 06041108100

Current Value:

Adults who Binge Drink Census Tract: 06041108100

15.0%
(2021)
Compared to:
Compared to CA Census Tracts, 06041108100 has a value of 15.0% which is in the best 50% of census tracts. Census tracts in the best 50% have a value lower than 15.9% while census tracts in the worst 25% have a value higher than 17.2%.
CA Census Tracts
The distribution is based on data from 8,005 California census tracts.
Compared to U.S. Census Tracts, 06041108100 has a value of 15.0% which is in the best 50% of census tracts. Census tracts in the best 50% have a value lower than 16.5% while census tracts in the worst 25% have a value higher than 18.3%.
U.S. Census Tracts
The distribution is based on data from 68,167 U.S. census tracts.
Compared to the Marin, CA County Value (14.8%), 06041108100 has a value of 15.0% which is higher and worse.
Marin, CA County Value
(14.8%)
The regional value is compared to the Marin County value.
Compared to the US Value (15.5%), 06041108100 has a value of 15.0% which is lower and better.
US Value
(15.5%)
The regional value is compared to the national value.

Adults who Binge Drink Census Tract: 06041108200

Current Value:

Adults who Binge Drink Census Tract: 06041108200

12.8%
(2021)
Compared to:
Compared to CA Census Tracts, 06041108200 has a value of 12.8% which is in the best 50% of census tracts. Census tracts in the best 50% have a value lower than 15.9% while census tracts in the worst 25% have a value higher than 17.2%.
CA Census Tracts
The distribution is based on data from 8,005 California census tracts.
Compared to U.S. Census Tracts, 06041108200 has a value of 12.8% which is in the best 50% of census tracts. Census tracts in the best 50% have a value lower than 16.5% while census tracts in the worst 25% have a value higher than 18.3%.
U.S. Census Tracts
The distribution is based on data from 68,167 U.S. census tracts.
Compared to the Marin, CA County Value (14.8%), 06041108200 has a value of 12.8% which is lower and better.
Marin, CA County Value
(14.8%)
The regional value is compared to the Marin County value.
Compared to the US Value (15.5%), 06041108200 has a value of 12.8% which is lower and better.
US Value
(15.5%)
The regional value is compared to the national value.

Adults who Binge Drink Census Tract: 06041109001

Current Value:

Adults who Binge Drink Census Tract: 06041109001

17.6%
(2021)
Compared to:
Compared to CA Census Tracts, 06041109001 has a value of 17.6% which is in the worst 25% of census tracts. Census tracts in the best 50% have a value lower than 15.9% while census tracts in the worst 25% have a value higher than 17.2%.
CA Census Tracts
The distribution is based on data from 8,005 California census tracts.
Compared to U.S. Census Tracts, 06041109001 has a value of 17.6% which is in the 2nd worst quartile of census tracts. Census tracts in the best 50% have a value lower than 16.5% while census tracts in the worst 25% have a value higher than 18.3%.
U.S. Census Tracts
The distribution is based on data from 68,167 U.S. census tracts.
Compared to the Marin, CA County Value (14.8%), 06041109001 has a value of 17.6% which is higher and worse.
Marin, CA County Value
(14.8%)
The regional value is compared to the Marin County value.
Compared to the US Value (15.5%), 06041109001 has a value of 17.6% which is higher and worse.
US Value
(15.5%)
The regional value is compared to the national value.

Adults who Binge Drink Census Tract: 06041109002

Current Value:

Adults who Binge Drink Census Tract: 06041109002

15.7%
(2021)
Compared to:
Compared to CA Census Tracts, 06041109002 has a value of 15.7% which is in the best 50% of census tracts. Census tracts in the best 50% have a value lower than 15.9% while census tracts in the worst 25% have a value higher than 17.2%.
CA Census Tracts
The distribution is based on data from 8,005 California census tracts.
Compared to U.S. Census Tracts, 06041109002 has a value of 15.7% which is in the best 50% of census tracts. Census tracts in the best 50% have a value lower than 16.5% while census tracts in the worst 25% have a value higher than 18.3%.
U.S. Census Tracts
The distribution is based on data from 68,167 U.S. census tracts.
Compared to the Marin, CA County Value (14.8%), 06041109002 has a value of 15.7% which is higher and worse.
Marin, CA County Value
(14.8%)
The regional value is compared to the Marin County value.
Compared to the US Value (15.5%), 06041109002 has a value of 15.7% which is higher and worse.
US Value
(15.5%)
The regional value is compared to the national value.

Adults who Binge Drink Census Tract: 06041110100

Current Value:

Adults who Binge Drink Census Tract: 06041110100

15.2%
(2021)
Compared to:
Compared to CA Census Tracts, 06041110100 has a value of 15.2% which is in the best 50% of census tracts. Census tracts in the best 50% have a value lower than 15.9% while census tracts in the worst 25% have a value higher than 17.2%.
CA Census Tracts
The distribution is based on data from 8,005 California census tracts.
Compared to U.S. Census Tracts, 06041110100 has a value of 15.2% which is in the best 50% of census tracts. Census tracts in the best 50% have a value lower than 16.5% while census tracts in the worst 25% have a value higher than 18.3%.
U.S. Census Tracts
The distribution is based on data from 68,167 U.S. census tracts.
Compared to the Marin, CA County Value (14.8%), 06041110100 has a value of 15.2% which is higher and worse.
Marin, CA County Value
(14.8%)
The regional value is compared to the Marin County value.
Compared to the US Value (15.5%), 06041110100 has a value of 15.2% which is lower and better.
US Value
(15.5%)
The regional value is compared to the national value.

Adults who Binge Drink Census Tract: 06041110200

Current Value:

Adults who Binge Drink Census Tract: 06041110200

14.5%
(2021)
Compared to:
Compared to CA Census Tracts, 06041110200 has a value of 14.5% which is in the best 50% of census tracts. Census tracts in the best 50% have a value lower than 15.9% while census tracts in the worst 25% have a value higher than 17.2%.
CA Census Tracts
The distribution is based on data from 8,005 California census tracts.
Compared to U.S. Census Tracts, 06041110200 has a value of 14.5% which is in the best 50% of census tracts. Census tracts in the best 50% have a value lower than 16.5% while census tracts in the worst 25% have a value higher than 18.3%.
U.S. Census Tracts
The distribution is based on data from 68,167 U.S. census tracts.
Compared to the Marin, CA County Value (14.8%), 06041110200 has a value of 14.5% which is lower and better.
Marin, CA County Value
(14.8%)
The regional value is compared to the Marin County value.
Compared to the US Value (15.5%), 06041110200 has a value of 14.5% which is lower and better.
US Value
(15.5%)
The regional value is compared to the national value.

Adults who Binge Drink Census Tract: 06041111000

Current Value:

Adults who Binge Drink Census Tract: 06041111000

18.3%
(2021)
Compared to:
Compared to CA Census Tracts, 06041111000 has a value of 18.3% which is in the worst 25% of census tracts. Census tracts in the best 50% have a value lower than 15.9% while census tracts in the worst 25% have a value higher than 17.2%.
CA Census Tracts
The distribution is based on data from 8,005 California census tracts.
Compared to U.S. Census Tracts, 06041111000 has a value of 18.3% which is in the worst 25% of census tracts. Census tracts in the best 50% have a value lower than 16.5% while census tracts in the worst 25% have a value higher than 18.3%.
U.S. Census Tracts
The distribution is based on data from 68,167 U.S. census tracts.
Compared to the Marin, CA County Value (14.8%), 06041111000 has a value of 18.3% which is higher and worse.
Marin, CA County Value
(14.8%)
The regional value is compared to the Marin County value.
Compared to the US Value (15.5%), 06041111000 has a value of 18.3% which is higher and worse.
US Value
(15.5%)
The regional value is compared to the national value.

Adults who Binge Drink Census Tract: 06041112100

Current Value:

Adults who Binge Drink Census Tract: 06041112100

17.1%
(2021)
Compared to:
Compared to CA Census Tracts, 06041112100 has a value of 17.1% which is in the 2nd worst quartile of census tracts. Census tracts in the best 50% have a value lower than 15.9% while census tracts in the worst 25% have a value higher than 17.2%.
CA Census Tracts
The distribution is based on data from 8,005 California census tracts.
Compared to U.S. Census Tracts, 06041112100 has a value of 17.1% which is in the 2nd worst quartile of census tracts. Census tracts in the best 50% have a value lower than 16.5% while census tracts in the worst 25% have a value higher than 18.3%.
U.S. Census Tracts
The distribution is based on data from 68,167 U.S. census tracts.
Compared to the Marin, CA County Value (14.8%), 06041112100 has a value of 17.1% which is higher and worse.
Marin, CA County Value
(14.8%)
The regional value is compared to the Marin County value.
Compared to the US Value (15.5%), 06041112100 has a value of 17.1% which is higher and worse.
US Value
(15.5%)
The regional value is compared to the national value.

Adults who Binge Drink Census Tract: 06041112201

Current Value:

Adults who Binge Drink Census Tract: 06041112201

17.6%
(2021)
Compared to:
Compared to CA Census Tracts, 06041112201 has a value of 17.6% which is in the worst 25% of census tracts. Census tracts in the best 50% have a value lower than 15.9% while census tracts in the worst 25% have a value higher than 17.2%.
CA Census Tracts
The distribution is based on data from 8,005 California census tracts.
Compared to U.S. Census Tracts, 06041112201 has a value of 17.6% which is in the 2nd worst quartile of census tracts. Census tracts in the best 50% have a value lower than 16.5% while census tracts in the worst 25% have a value higher than 18.3%.
U.S. Census Tracts
The distribution is based on data from 68,167 U.S. census tracts.
Compared to the Marin, CA County Value (14.8%), 06041112201 has a value of 17.6% which is higher and worse.
Marin, CA County Value
(14.8%)
The regional value is compared to the Marin County value.
Compared to the US Value (15.5%), 06041112201 has a value of 17.6% which is higher and worse.
US Value
(15.5%)
The regional value is compared to the national value.

Adults who Binge Drink Census Tract: 06041112202

Current Value:

Adults who Binge Drink Census Tract: 06041112202

15.6%
(2021)
Compared to:
Compared to CA Census Tracts, 06041112202 has a value of 15.6% which is in the best 50% of census tracts. Census tracts in the best 50% have a value lower than 15.9% while census tracts in the worst 25% have a value higher than 17.2%.
CA Census Tracts
The distribution is based on data from 8,005 California census tracts.
Compared to U.S. Census Tracts, 06041112202 has a value of 15.6% which is in the best 50% of census tracts. Census tracts in the best 50% have a value lower than 16.5% while census tracts in the worst 25% have a value higher than 18.3%.
U.S. Census Tracts
The distribution is based on data from 68,167 U.S. census tracts.
Compared to the Marin, CA County Value (14.8%), 06041112202 has a value of 15.6% which is higher and worse.
Marin, CA County Value
(14.8%)
The regional value is compared to the Marin County value.
Compared to the US Value (15.5%), 06041112202 has a value of 15.6% which is higher and worse.
US Value
(15.5%)
The regional value is compared to the national value.

Adults who Binge Drink Census Tract: 06041113000

Current Value:

Adults who Binge Drink Census Tract: 06041113000

15.6%
(2021)
Compared to:
Compared to CA Census Tracts, 06041113000 has a value of 15.6% which is in the best 50% of census tracts. Census tracts in the best 50% have a value lower than 15.9% while census tracts in the worst 25% have a value higher than 17.2%.
CA Census Tracts
The distribution is based on data from 8,005 California census tracts.
Compared to U.S. Census Tracts, 06041113000 has a value of 15.6% which is in the best 50% of census tracts. Census tracts in the best 50% have a value lower than 16.5% while census tracts in the worst 25% have a value higher than 18.3%.
U.S. Census Tracts
The distribution is based on data from 68,167 U.S. census tracts.
Compared to the Marin, CA County Value (14.8%), 06041113000 has a value of 15.6% which is higher and worse.
Marin, CA County Value
(14.8%)
The regional value is compared to the Marin County value.
Compared to the US Value (15.5%), 06041113000 has a value of 15.6% which is higher and worse.
US Value
(15.5%)
The regional value is compared to the national value.

Adults who Binge Drink Census Tract: 06041114100

Current Value:

Adults who Binge Drink Census Tract: 06041114100

17.3%
(2021)
Compared to:
Compared to CA Census Tracts, 06041114100 has a value of 17.3% which is in the worst 25% of census tracts. Census tracts in the best 50% have a value lower than 15.9% while census tracts in the worst 25% have a value higher than 17.2%.
CA Census Tracts
The distribution is based on data from 8,005 California census tracts.
Compared to U.S. Census Tracts, 06041114100 has a value of 17.3% which is in the 2nd worst quartile of census tracts. Census tracts in the best 50% have a value lower than 16.5% while census tracts in the worst 25% have a value higher than 18.3%.
U.S. Census Tracts
The distribution is based on data from 68,167 U.S. census tracts.
Compared to the Marin, CA County Value (14.8%), 06041114100 has a value of 17.3% which is higher and worse.
Marin, CA County Value
(14.8%)
The regional value is compared to the Marin County value.
Compared to the US Value (15.5%), 06041114100 has a value of 17.3% which is higher and worse.
US Value
(15.5%)
The regional value is compared to the national value.

Adults who Binge Drink Census Tract: 06041114200

Current Value:

Adults who Binge Drink Census Tract: 06041114200

16.7%
(2021)
Compared to:
Compared to CA Census Tracts, 06041114200 has a value of 16.7% which is in the 2nd worst quartile of census tracts. Census tracts in the best 50% have a value lower than 15.9% while census tracts in the worst 25% have a value higher than 17.2%.
CA Census Tracts
The distribution is based on data from 8,005 California census tracts.
Compared to U.S. Census Tracts, 06041114200 has a value of 16.7% which is in the 2nd worst quartile of census tracts. Census tracts in the best 50% have a value lower than 16.5% while census tracts in the worst 25% have a value higher than 18.3%.
U.S. Census Tracts
The distribution is based on data from 68,167 U.S. census tracts.
Compared to the Marin, CA County Value (14.8%), 06041114200 has a value of 16.7% which is higher and worse.
Marin, CA County Value
(14.8%)
The regional value is compared to the Marin County value.
Compared to the US Value (15.5%), 06041114200 has a value of 16.7% which is higher and worse.
US Value
(15.5%)
The regional value is compared to the national value.

Adults who Binge Drink Census Tract: 06041115000

Current Value:

Adults who Binge Drink Census Tract: 06041115000

16.4%
(2021)
Compared to:
Compared to CA Census Tracts, 06041115000 has a value of 16.4% which is in the 2nd worst quartile of census tracts. Census tracts in the best 50% have a value lower than 15.9% while census tracts in the worst 25% have a value higher than 17.2%.
CA Census Tracts
The distribution is based on data from 8,005 California census tracts.
Compared to U.S. Census Tracts, 06041115000 has a value of 16.4% which is in the best 50% of census tracts. Census tracts in the best 50% have a value lower than 16.5% while census tracts in the worst 25% have a value higher than 18.3%.
U.S. Census Tracts
The distribution is based on data from 68,167 U.S. census tracts.
Compared to the Marin, CA County Value (14.8%), 06041115000 has a value of 16.4% which is higher and worse.
Marin, CA County Value
(14.8%)
The regional value is compared to the Marin County value.
Compared to the US Value (15.5%), 06041115000 has a value of 16.4% which is higher and worse.
US Value
(15.5%)
The regional value is compared to the national value.

Adults who Binge Drink Census Tract: 06041116000

Current Value:

Adults who Binge Drink Census Tract: 06041116000

17.8%
(2021)
Compared to:
Compared to CA Census Tracts, 06041116000 has a value of 17.8% which is in the worst 25% of census tracts. Census tracts in the best 50% have a value lower than 15.9% while census tracts in the worst 25% have a value higher than 17.2%.
CA Census Tracts
The distribution is based on data from 8,005 California census tracts.
Compared to U.S. Census Tracts, 06041116000 has a value of 17.8% which is in the 2nd worst quartile of census tracts. Census tracts in the best 50% have a value lower than 16.5% while census tracts in the worst 25% have a value higher than 18.3%.
U.S. Census Tracts
The distribution is based on data from 68,167 U.S. census tracts.
Compared to the Marin, CA County Value (14.8%), 06041116000 has a value of 17.8% which is higher and worse.
Marin, CA County Value
(14.8%)
The regional value is compared to the Marin County value.
Compared to the US Value (15.5%), 06041116000 has a value of 17.8% which is higher and worse.
US Value
(15.5%)
The regional value is compared to the national value.

Adults who Binge Drink Census Tract: 06041117000

Current Value:

Adults who Binge Drink Census Tract: 06041117000

16.3%
(2021)
Compared to:
Compared to CA Census Tracts, 06041117000 has a value of 16.3% which is in the 2nd worst quartile of census tracts. Census tracts in the best 50% have a value lower than 15.9% while census tracts in the worst 25% have a value higher than 17.2%.
CA Census Tracts
The distribution is based on data from 8,005 California census tracts.
Compared to U.S. Census Tracts, 06041117000 has a value of 16.3% which is in the best 50% of census tracts. Census tracts in the best 50% have a value lower than 16.5% while census tracts in the worst 25% have a value higher than 18.3%.
U.S. Census Tracts
The distribution is based on data from 68,167 U.S. census tracts.
Compared to the Marin, CA County Value (14.8%), 06041117000 has a value of 16.3% which is higher and worse.
Marin, CA County Value
(14.8%)
The regional value is compared to the Marin County value.
Compared to the US Value (15.5%), 06041117000 has a value of 16.3% which is higher and worse.
US Value
(15.5%)
The regional value is compared to the national value.

Adults who Binge Drink Census Tract: 06041118100

Current Value:

Adults who Binge Drink Census Tract: 06041118100

15.5%
(2021)
Compared to:
Compared to CA Census Tracts, 06041118100 has a value of 15.5% which is in the best 50% of census tracts. Census tracts in the best 50% have a value lower than 15.9% while census tracts in the worst 25% have a value higher than 17.2%.
CA Census Tracts
The distribution is based on data from 8,005 California census tracts.
Compared to U.S. Census Tracts, 06041118100 has a value of 15.5% which is in the best 50% of census tracts. Census tracts in the best 50% have a value lower than 16.5% while census tracts in the worst 25% have a value higher than 18.3%.
U.S. Census Tracts
The distribution is based on data from 68,167 U.S. census tracts.
Compared to the Marin, CA County Value (14.8%), 06041118100 has a value of 15.5% which is higher and worse.
Marin, CA County Value
(14.8%)
The regional value is compared to the Marin County value.
Compared to the US Value (15.5%), 06041118100 has a value of 15.5%.
US Value
(15.5%)
The regional value is compared to the national value.

Adults who Binge Drink Census Tract: 06041119100

Current Value:

Adults who Binge Drink Census Tract: 06041119100

15.1%
(2021)
Compared to:
Compared to CA Census Tracts, 06041119100 has a value of 15.1% which is in the best 50% of census tracts. Census tracts in the best 50% have a value lower than 15.9% while census tracts in the worst 25% have a value higher than 17.2%.
CA Census Tracts
The distribution is based on data from 8,005 California census tracts.
Compared to U.S. Census Tracts, 06041119100 has a value of 15.1% which is in the best 50% of census tracts. Census tracts in the best 50% have a value lower than 16.5% while census tracts in the worst 25% have a value higher than 18.3%.
U.S. Census Tracts
The distribution is based on data from 68,167 U.S. census tracts.
Compared to the Marin, CA County Value (14.8%), 06041119100 has a value of 15.1% which is higher and worse.
Marin, CA County Value
(14.8%)
The regional value is compared to the Marin County value.
Compared to the US Value (15.5%), 06041119100 has a value of 15.1% which is lower and better.
US Value
(15.5%)
The regional value is compared to the national value.

Adults who Binge Drink Census Tract: 06041119201

Current Value:

Adults who Binge Drink Census Tract: 06041119201

12.8%
(2021)
Compared to:
Compared to CA Census Tracts, 06041119201 has a value of 12.8% which is in the best 50% of census tracts. Census tracts in the best 50% have a value lower than 15.9% while census tracts in the worst 25% have a value higher than 17.2%.
CA Census Tracts
The distribution is based on data from 8,005 California census tracts.
Compared to U.S. Census Tracts, 06041119201 has a value of 12.8% which is in the best 50% of census tracts. Census tracts in the best 50% have a value lower than 16.5% while census tracts in the worst 25% have a value higher than 18.3%.
U.S. Census Tracts
The distribution is based on data from 68,167 U.S. census tracts.
Compared to the Marin, CA County Value (14.8%), 06041119201 has a value of 12.8% which is lower and better.
Marin, CA County Value
(14.8%)
The regional value is compared to the Marin County value.
Compared to the US Value (15.5%), 06041119201 has a value of 12.8% which is lower and better.
US Value
(15.5%)
The regional value is compared to the national value.

Adults who Binge Drink Census Tract: 06041119202

Current Value:

Adults who Binge Drink Census Tract: 06041119202

14.6%
(2021)
Compared to:
Compared to CA Census Tracts, 06041119202 has a value of 14.6% which is in the best 50% of census tracts. Census tracts in the best 50% have a value lower than 15.9% while census tracts in the worst 25% have a value higher than 17.2%.
CA Census Tracts
The distribution is based on data from 8,005 California census tracts.
Compared to U.S. Census Tracts, 06041119202 has a value of 14.6% which is in the best 50% of census tracts. Census tracts in the best 50% have a value lower than 16.5% while census tracts in the worst 25% have a value higher than 18.3%.
U.S. Census Tracts
The distribution is based on data from 68,167 U.S. census tracts.
Compared to the Marin, CA County Value (14.8%), 06041119202 has a value of 14.6% which is lower and better.
Marin, CA County Value
(14.8%)
The regional value is compared to the Marin County value.
Compared to the US Value (15.5%), 06041119202 has a value of 14.6% which is lower and better.
US Value
(15.5%)
The regional value is compared to the national value.

Adults who Binge Drink Census Tract: 06041120000

Current Value:

Adults who Binge Drink Census Tract: 06041120000

15.4%
(2021)
Compared to:
Compared to CA Census Tracts, 06041120000 has a value of 15.4% which is in the best 50% of census tracts. Census tracts in the best 50% have a value lower than 15.9% while census tracts in the worst 25% have a value higher than 17.2%.
CA Census Tracts
The distribution is based on data from 8,005 California census tracts.
Compared to U.S. Census Tracts, 06041120000 has a value of 15.4% which is in the best 50% of census tracts. Census tracts in the best 50% have a value lower than 16.5% while census tracts in the worst 25% have a value higher than 18.3%.
U.S. Census Tracts
The distribution is based on data from 68,167 U.S. census tracts.
Compared to the Marin, CA County Value (14.8%), 06041120000 has a value of 15.4% which is higher and worse.
Marin, CA County Value
(14.8%)
The regional value is compared to the Marin County value.
Compared to the US Value (15.5%), 06041120000 has a value of 15.4% which is lower and better.
US Value
(15.5%)
The regional value is compared to the national value.

Adults who Binge Drink Census Tract: 06041121100

Current Value:

Adults who Binge Drink Census Tract: 06041121100

16.5%
(2021)
Compared to:
Compared to CA Census Tracts, 06041121100 has a value of 16.5% which is in the 2nd worst quartile of census tracts. Census tracts in the best 50% have a value lower than 15.9% while census tracts in the worst 25% have a value higher than 17.2%.
CA Census Tracts
The distribution is based on data from 8,005 California census tracts.
Compared to U.S. Census Tracts, 06041121100 has a value of 16.5% which is in the best 50% of census tracts. Census tracts in the best 50% have a value lower than 16.5% while census tracts in the worst 25% have a value higher than 18.3%.
U.S. Census Tracts
The distribution is based on data from 68,167 U.S. census tracts.
Compared to the Marin, CA County Value (14.8%), 06041121100 has a value of 16.5% which is higher and worse.
Marin, CA County Value
(14.8%)
The regional value is compared to the Marin County value.
Compared to the US Value (15.5%), 06041121100 has a value of 16.5% which is higher and worse.
US Value
(15.5%)
The regional value is compared to the national value.

Adults who Binge Drink Census Tract: 06041121200

Current Value:

Adults who Binge Drink Census Tract: 06041121200

15.8%
(2021)
Compared to:
Compared to CA Census Tracts, 06041121200 has a value of 15.8% which is in the best 50% of census tracts. Census tracts in the best 50% have a value lower than 15.9% while census tracts in the worst 25% have a value higher than 17.2%.
CA Census Tracts
The distribution is based on data from 8,005 California census tracts.
Compared to U.S. Census Tracts, 06041121200 has a value of 15.8% which is in the best 50% of census tracts. Census tracts in the best 50% have a value lower than 16.5% while census tracts in the worst 25% have a value higher than 18.3%.
U.S. Census Tracts
The distribution is based on data from 68,167 U.S. census tracts.
Compared to the Marin, CA County Value (14.8%), 06041121200 has a value of 15.8% which is higher and worse.
Marin, CA County Value
(14.8%)
The regional value is compared to the Marin County value.
Compared to the US Value (15.5%), 06041121200 has a value of 15.8% which is higher and worse.
US Value
(15.5%)
The regional value is compared to the national value.

Adults who Binge Drink Census Tract: 06041122000

Current Value:

Adults who Binge Drink Census Tract: 06041122000

22.6%
(2021)
Compared to:
Compared to CA Census Tracts, 06041122000 has a value of 22.6% which is in the worst 25% of census tracts. Census tracts in the best 50% have a value lower than 15.9% while census tracts in the worst 25% have a value higher than 17.2%.
CA Census Tracts
The distribution is based on data from 8,005 California census tracts.
Compared to U.S. Census Tracts, 06041122000 has a value of 22.6% which is in the worst 25% of census tracts. Census tracts in the best 50% have a value lower than 16.5% while census tracts in the worst 25% have a value higher than 18.3%.
U.S. Census Tracts
The distribution is based on data from 68,167 U.S. census tracts.
Compared to the Marin, CA County Value (14.8%), 06041122000 has a value of 22.6% which is higher and worse.
Marin, CA County Value
(14.8%)
The regional value is compared to the Marin County value.
Compared to the US Value (15.5%), 06041122000 has a value of 22.6% which is higher and worse.
US Value
(15.5%)
The regional value is compared to the national value.

Adults who Binge Drink Census Tract: 06041123000

Current Value:

Adults who Binge Drink Census Tract: 06041123000

12.6%
(2021)
Compared to:
Compared to CA Census Tracts, 06041123000 has a value of 12.6% which is in the best 50% of census tracts. Census tracts in the best 50% have a value lower than 15.9% while census tracts in the worst 25% have a value higher than 17.2%.
CA Census Tracts
The distribution is based on data from 8,005 California census tracts.
Compared to U.S. Census Tracts, 06041123000 has a value of 12.6% which is in the best 50% of census tracts. Census tracts in the best 50% have a value lower than 16.5% while census tracts in the worst 25% have a value higher than 18.3%.
U.S. Census Tracts
The distribution is based on data from 68,167 U.S. census tracts.
Compared to the Marin, CA County Value (14.8%), 06041123000 has a value of 12.6% which is lower and better.
Marin, CA County Value
(14.8%)
The regional value is compared to the Marin County value.
Compared to the US Value (15.5%), 06041123000 has a value of 12.6% which is lower and better.
US Value
(15.5%)
The regional value is compared to the national value.

Adults who Binge Drink Census Tract: 06041124100

Current Value:

Adults who Binge Drink Census Tract: 06041124100

15.7%
(2021)
Compared to:
Compared to CA Census Tracts, 06041124100 has a value of 15.7% which is in the best 50% of census tracts. Census tracts in the best 50% have a value lower than 15.9% while census tracts in the worst 25% have a value higher than 17.2%.
CA Census Tracts
The distribution is based on data from 8,005 California census tracts.
Compared to U.S. Census Tracts, 06041124100 has a value of 15.7% which is in the best 50% of census tracts. Census tracts in the best 50% have a value lower than 16.5% while census tracts in the worst 25% have a value higher than 18.3%.
U.S. Census Tracts
The distribution is based on data from 68,167 U.S. census tracts.
Compared to the Marin, CA County Value (14.8%), 06041124100 has a value of 15.7% which is higher and worse.
Marin, CA County Value
(14.8%)
The regional value is compared to the Marin County value.
Compared to the US Value (15.5%), 06041124100 has a value of 15.7% which is higher and worse.
US Value
(15.5%)
The regional value is compared to the national value.

Adults who Binge Drink Census Tract: 06041124200

Current Value:

Adults who Binge Drink Census Tract: 06041124200

13.6%
(2021)
Compared to:
Compared to CA Census Tracts, 06041124200 has a value of 13.6% which is in the best 50% of census tracts. Census tracts in the best 50% have a value lower than 15.9% while census tracts in the worst 25% have a value higher than 17.2%.
CA Census Tracts
The distribution is based on data from 8,005 California census tracts.
Compared to U.S. Census Tracts, 06041124200 has a value of 13.6% which is in the best 50% of census tracts. Census tracts in the best 50% have a value lower than 16.5% while census tracts in the worst 25% have a value higher than 18.3%.
U.S. Census Tracts
The distribution is based on data from 68,167 U.S. census tracts.
Compared to the Marin, CA County Value (14.8%), 06041124200 has a value of 13.6% which is lower and better.
Marin, CA County Value
(14.8%)
The regional value is compared to the Marin County value.
Compared to the US Value (15.5%), 06041124200 has a value of 13.6% which is lower and better.
US Value
(15.5%)
The regional value is compared to the national value.

Adults who Binge Drink Census Tract: 06041125000

Current Value:

Adults who Binge Drink Census Tract: 06041125000

16.1%
(2021)
Compared to:
Compared to CA Census Tracts, 06041125000 has a value of 16.1% which is in the 2nd worst quartile of census tracts. Census tracts in the best 50% have a value lower than 15.9% while census tracts in the worst 25% have a value higher than 17.2%.
CA Census Tracts
The distribution is based on data from 8,005 California census tracts.
Compared to U.S. Census Tracts, 06041125000 has a value of 16.1% which is in the best 50% of census tracts. Census tracts in the best 50% have a value lower than 16.5% while census tracts in the worst 25% have a value higher than 18.3%.
U.S. Census Tracts
The distribution is based on data from 68,167 U.S. census tracts.
Compared to the Marin, CA County Value (14.8%), 06041125000 has a value of 16.1% which is higher and worse.
Marin, CA County Value
(14.8%)
The regional value is compared to the Marin County value.
Compared to the US Value (15.5%), 06041125000 has a value of 16.1% which is higher and worse.
US Value
(15.5%)
The regional value is compared to the national value.

Adults who Binge Drink Census Tract: 06041126100

Current Value:

Adults who Binge Drink Census Tract: 06041126100

16.6%
(2021)
Compared to:
Compared to CA Census Tracts, 06041126100 has a value of 16.6% which is in the 2nd worst quartile of census tracts. Census tracts in the best 50% have a value lower than 15.9% while census tracts in the worst 25% have a value higher than 17.2%.
CA Census Tracts
The distribution is based on data from 8,005 California census tracts.
Compared to U.S. Census Tracts, 06041126100 has a value of 16.6% which is in the 2nd worst quartile of census tracts. Census tracts in the best 50% have a value lower than 16.5% while census tracts in the worst 25% have a value higher than 18.3%.
U.S. Census Tracts
The distribution is based on data from 68,167 U.S. census tracts.
Compared to the Marin, CA County Value (14.8%), 06041126100 has a value of 16.6% which is higher and worse.
Marin, CA County Value
(14.8%)
The regional value is compared to the Marin County value.
Compared to the US Value (15.5%), 06041126100 has a value of 16.6% which is higher and worse.
US Value
(15.5%)
The regional value is compared to the national value.

Adults who Binge Drink Census Tract: 06041126200

Current Value:

Adults who Binge Drink Census Tract: 06041126200

13.4%
(2021)
Compared to:
Compared to CA Census Tracts, 06041126200 has a value of 13.4% which is in the best 50% of census tracts. Census tracts in the best 50% have a value lower than 15.9% while census tracts in the worst 25% have a value higher than 17.2%.
CA Census Tracts
The distribution is based on data from 8,005 California census tracts.
Compared to U.S. Census Tracts, 06041126200 has a value of 13.4% which is in the best 50% of census tracts. Census tracts in the best 50% have a value lower than 16.5% while census tracts in the worst 25% have a value higher than 18.3%.
U.S. Census Tracts
The distribution is based on data from 68,167 U.S. census tracts.
Compared to the Marin, CA County Value (14.8%), 06041126200 has a value of 13.4% which is lower and better.
Marin, CA County Value
(14.8%)
The regional value is compared to the Marin County value.
Compared to the US Value (15.5%), 06041126200 has a value of 13.4% which is lower and better.
US Value
(15.5%)
The regional value is compared to the national value.

Adults who Binge Drink Census Tract: 06041127000

Current Value:

Adults who Binge Drink Census Tract: 06041127000

16.0%
(2021)
Compared to:
Compared to CA Census Tracts, 06041127000 has a value of 16.0% which is in the 2nd worst quartile of census tracts. Census tracts in the best 50% have a value lower than 15.9% while census tracts in the worst 25% have a value higher than 17.2%.
CA Census Tracts
The distribution is based on data from 8,005 California census tracts.
Compared to U.S. Census Tracts, 06041127000 has a value of 16.0% which is in the best 50% of census tracts. Census tracts in the best 50% have a value lower than 16.5% while census tracts in the worst 25% have a value higher than 18.3%.
U.S. Census Tracts
The distribution is based on data from 68,167 U.S. census tracts.
Compared to the Marin, CA County Value (14.8%), 06041127000 has a value of 16.0% which is higher and worse.
Marin, CA County Value
(14.8%)
The regional value is compared to the Marin County value.
Compared to the US Value (15.5%), 06041127000 has a value of 16.0% which is higher and worse.
US Value
(15.5%)
The regional value is compared to the national value.

Adults who Binge Drink Census Tract: 06041128100

Current Value:

Adults who Binge Drink Census Tract: 06041128100

16.8%
(2021)
Compared to:
Compared to CA Census Tracts, 06041128100 has a value of 16.8% which is in the 2nd worst quartile of census tracts. Census tracts in the best 50% have a value lower than 15.9% while census tracts in the worst 25% have a value higher than 17.2%.
CA Census Tracts
The distribution is based on data from 8,005 California census tracts.
Compared to U.S. Census Tracts, 06041128100 has a value of 16.8% which is in the 2nd worst quartile of census tracts. Census tracts in the best 50% have a value lower than 16.5% while census tracts in the worst 25% have a value higher than 18.3%.
U.S. Census Tracts
The distribution is based on data from 68,167 U.S. census tracts.
Compared to the Marin, CA County Value (14.8%), 06041128100 has a value of 16.8% which is higher and worse.
Marin, CA County Value
(14.8%)
The regional value is compared to the Marin County value.
Compared to the US Value (15.5%), 06041128100 has a value of 16.8% which is higher and worse.
US Value
(15.5%)
The regional value is compared to the national value.

Adults who Binge Drink Census Tract: 06041128200

Current Value:

Adults who Binge Drink Census Tract: 06041128200

16.0%
(2021)
Compared to:
Compared to CA Census Tracts, 06041128200 has a value of 16.0% which is in the 2nd worst quartile of census tracts. Census tracts in the best 50% have a value lower than 15.9% while census tracts in the worst 25% have a value higher than 17.2%.
CA Census Tracts
The distribution is based on data from 8,005 California census tracts.
Compared to U.S. Census Tracts, 06041128200 has a value of 16.0% which is in the best 50% of census tracts. Census tracts in the best 50% have a value lower than 16.5% while census tracts in the worst 25% have a value higher than 18.3%.
U.S. Census Tracts
The distribution is based on data from 68,167 U.S. census tracts.
Compared to the Marin, CA County Value (14.8%), 06041128200 has a value of 16.0% which is higher and worse.
Marin, CA County Value
(14.8%)
The regional value is compared to the Marin County value.
Compared to the US Value (15.5%), 06041128200 has a value of 16.0% which is higher and worse.
US Value
(15.5%)
The regional value is compared to the national value.

Adults who Binge Drink Census Tract: 06041129000

Current Value:

Adults who Binge Drink Census Tract: 06041129000

13.8%
(2021)
Compared to:
Compared to CA Census Tracts, 06041129000 has a value of 13.8% which is in the best 50% of census tracts. Census tracts in the best 50% have a value lower than 15.9% while census tracts in the worst 25% have a value higher than 17.2%.
CA Census Tracts
The distribution is based on data from 8,005 California census tracts.
Compared to U.S. Census Tracts, 06041129000 has a value of 13.8% which is in the best 50% of census tracts. Census tracts in the best 50% have a value lower than 16.5% while census tracts in the worst 25% have a value higher than 18.3%.
U.S. Census Tracts
The distribution is based on data from 68,167 U.S. census tracts.
Compared to the Marin, CA County Value (14.8%), 06041129000 has a value of 13.8% which is lower and better.
Marin, CA County Value
(14.8%)
The regional value is compared to the Marin County value.
Compared to the US Value (15.5%), 06041129000 has a value of 13.8% which is lower and better.
US Value
(15.5%)
The regional value is compared to the national value.

Adults who Binge Drink Census Tract: 06041130201

Current Value:

Adults who Binge Drink Census Tract: 06041130201

15.5%
(2021)
Compared to:
Compared to CA Census Tracts, 06041130201 has a value of 15.5% which is in the best 50% of census tracts. Census tracts in the best 50% have a value lower than 15.9% while census tracts in the worst 25% have a value higher than 17.2%.
CA Census Tracts
The distribution is based on data from 8,005 California census tracts.
Compared to U.S. Census Tracts, 06041130201 has a value of 15.5% which is in the best 50% of census tracts. Census tracts in the best 50% have a value lower than 16.5% while census tracts in the worst 25% have a value higher than 18.3%.
U.S. Census Tracts
The distribution is based on data from 68,167 U.S. census tracts.
Compared to the Marin, CA County Value (14.8%), 06041130201 has a value of 15.5% which is higher and worse.
Marin, CA County Value
(14.8%)
The regional value is compared to the Marin County value.
Compared to the US Value (15.5%), 06041130201 has a value of 15.5%.
US Value
(15.5%)
The regional value is compared to the national value.

Adults who Binge Drink Census Tract: 06041130202

Current Value:

Adults who Binge Drink Census Tract: 06041130202

16.3%
(2021)
Compared to:
Compared to CA Census Tracts, 06041130202 has a value of 16.3% which is in the 2nd worst quartile of census tracts. Census tracts in the best 50% have a value lower than 15.9% while census tracts in the worst 25% have a value higher than 17.2%.
CA Census Tracts
The distribution is based on data from 8,005 California census tracts.
Compared to U.S. Census Tracts, 06041130202 has a value of 16.3% which is in the best 50% of census tracts. Census tracts in the best 50% have a value lower than 16.5% while census tracts in the worst 25% have a value higher than 18.3%.
U.S. Census Tracts
The distribution is based on data from 68,167 U.S. census tracts.
Compared to the Marin, CA County Value (14.8%), 06041130202 has a value of 16.3% which is higher and worse.
Marin, CA County Value
(14.8%)
The regional value is compared to the Marin County value.
Compared to the US Value (15.5%), 06041130202 has a value of 16.3% which is higher and worse.
US Value
(15.5%)
The regional value is compared to the national value.

Adults who Binge Drink Census Tract: 06041131100

Current Value:

Adults who Binge Drink Census Tract: 06041131100

17.1%
(2021)
Compared to:
Compared to CA Census Tracts, 06041131100 has a value of 17.1% which is in the 2nd worst quartile of census tracts. Census tracts in the best 50% have a value lower than 15.9% while census tracts in the worst 25% have a value higher than 17.2%.
CA Census Tracts
The distribution is based on data from 8,005 California census tracts.
Compared to U.S. Census Tracts, 06041131100 has a value of 17.1% which is in the 2nd worst quartile of census tracts. Census tracts in the best 50% have a value lower than 16.5% while census tracts in the worst 25% have a value higher than 18.3%.
U.S. Census Tracts
The distribution is based on data from 68,167 U.S. census tracts.
Compared to the Marin, CA County Value (14.8%), 06041131100 has a value of 17.1% which is higher and worse.
Marin, CA County Value
(14.8%)
The regional value is compared to the Marin County value.
Compared to the US Value (15.5%), 06041131100 has a value of 17.1% which is higher and worse.
US Value
(15.5%)
The regional value is compared to the national value.

Adults who Binge Drink Census Tract: 06041132100

Current Value:

Adults who Binge Drink Census Tract: 06041132100

15.2%
(2021)
Compared to:
Compared to CA Census Tracts, 06041132100 has a value of 15.2% which is in the best 50% of census tracts. Census tracts in the best 50% have a value lower than 15.9% while census tracts in the worst 25% have a value higher than 17.2%.
CA Census Tracts
The distribution is based on data from 8,005 California census tracts.
Compared to U.S. Census Tracts, 06041132100 has a value of 15.2% which is in the best 50% of census tracts. Census tracts in the best 50% have a value lower than 16.5% while census tracts in the worst 25% have a value higher than 18.3%.
U.S. Census Tracts
The distribution is based on data from 68,167 U.S. census tracts.
Compared to the Marin, CA County Value (14.8%), 06041132100 has a value of 15.2% which is higher and worse.
Marin, CA County Value
(14.8%)
The regional value is compared to the Marin County value.
Compared to the US Value (15.5%), 06041132100 has a value of 15.2% which is lower and better.
US Value
(15.5%)
The regional value is compared to the national value.

Adults who Binge Drink Census Tract: 06041132200

Current Value:

Adults who Binge Drink Census Tract: 06041132200

14.3%
(2021)
Compared to:
Compared to CA Census Tracts, 06041132200 has a value of 14.3% which is in the best 50% of census tracts. Census tracts in the best 50% have a value lower than 15.9% while census tracts in the worst 25% have a value higher than 17.2%.
CA Census Tracts
The distribution is based on data from 8,005 California census tracts.
Compared to U.S. Census Tracts, 06041132200 has a value of 14.3% which is in the best 50% of census tracts. Census tracts in the best 50% have a value lower than 16.5% while census tracts in the worst 25% have a value higher than 18.3%.
U.S. Census Tracts
The distribution is based on data from 68,167 U.S. census tracts.
Compared to the Marin, CA County Value (14.8%), 06041132200 has a value of 14.3% which is lower and better.
Marin, CA County Value
(14.8%)
The regional value is compared to the Marin County value.
Compared to the US Value (15.5%), 06041132200 has a value of 14.3% which is lower and better.
US Value
(15.5%)
The regional value is compared to the national value.

Adults who Binge Drink Census Tract: 06041133000

Current Value:

Adults who Binge Drink Census Tract: 06041133000

15.8%
(2021)
Compared to:
Compared to CA Census Tracts, 06041133000 has a value of 15.8% which is in the best 50% of census tracts. Census tracts in the best 50% have a value lower than 15.9% while census tracts in the worst 25% have a value higher than 17.2%.
CA Census Tracts
The distribution is based on data from 8,005 California census tracts.
Compared to U.S. Census Tracts, 06041133000 has a value of 15.8% which is in the best 50% of census tracts. Census tracts in the best 50% have a value lower than 16.5% while census tracts in the worst 25% have a value higher than 18.3%.
U.S. Census Tracts
The distribution is based on data from 68,167 U.S. census tracts.
Compared to the Marin, CA County Value (14.8%), 06041133000 has a value of 15.8% which is higher and worse.
Marin, CA County Value
(14.8%)
The regional value is compared to the Marin County value.
Compared to the US Value (15.5%), 06041133000 has a value of 15.8% which is higher and worse.
US Value
(15.5%)
The regional value is compared to the national value.

Health / Alcohol & Drug Use

Age-Adjusted Death Rate due to All Opioid Overdose

Value
Compared to:

Health / Alcohol & Drug Use

Age-Adjusted Death Rate due to All Opioid Overdose

Value
Compared to:

Age-Adjusted Death Rate due to All Opioid Overdose County: Marin

Current Value:

Age-Adjusted Death Rate due to All Opioid Overdose County: Marin

15.8
Rate per 100,000 residents
(2022)
Compared to:
Compared to CA Counties, Marin has a value of 15.8 which is in the best 50% of counties. Counties in the best 50% have a value lower than 17.7 while counties in the worst 25% have a value higher than 25.4.
CA Counties
The distribution is based on data from 58 California counties.
Compared to the CA Value (18.7), Marin has a value of 15.8 which is lower and better.
CA Value
(18.7)
The regional value is compared to the California state value.
Compared to the prior value, Marin (15.8) is less and better than the previously measured value (18.2).
Prior Value
(18.2)
Prior Value compares a measured value with the previously measured value. Confidence intervals were not taken into account in determining the direction of the comparison.
Over time, the Marin value is increasing significantly.
Trend
This comparison measures the indicator’s values over multiple time periods.<br>The Mann-Kendall Test for Statistical Significance is used to evaluate the trend<br>over 4 to 10 periods of measure, subject to data availability and comparability.

Health / Alcohol & Drug Use

Age-Adjusted Death Rate due to Drug Use

Value
Compared to:

Health / Alcohol & Drug Use

Age-Adjusted Death Rate due to Drug Use

Value
Compared to:

Age-Adjusted Death Rate due to Drug Use County: Marin

Current Value:

Age-Adjusted Death Rate due to Drug Use County: Marin

20.4
Deaths per 100,000 population
(2019-2021)
Compared to:
Compared to CA Counties, Marin has a value of 20.4 which is in the best 50% of counties. Counties in the best 50% have a value lower than 22.3 while counties in the worst 25% have a value higher than 31.0.
CA Counties
The distribution is based on data from 57 California counties.
Compared to the CA Value (21.4), Marin has a value of 20.4 which is lower and better.
CA Value
(21.4)
The regional value is compared to the California state value.
Compared to the prior value, Marin (20.4) is not statistically different from the previously measured value (16.9).
Prior Value
(16.9)
Prior Value compares a measured value with the previously measured value. Confidence intervals were taken into account in determining the direction of the comparison.
Over time, the Marin value is increasing significantly.
Trend
This comparison measures the indicator’s values over multiple time periods.<br>The Mann-Kendall Test for Statistical Significance is used to evaluate the trend<br>over 4 to 10 periods of measure, subject to data availability and comparability.

Health / Alcohol & Drug Use

Age-Adjusted Death Rate due to Fentanyl Overdose

Value
Compared to:

Health / Alcohol & Drug Use

Age-Adjusted Death Rate due to Fentanyl Overdose

Value
Compared to:

Age-Adjusted Death Rate due to Fentanyl Overdose County: Marin

Current Value:

Age-Adjusted Death Rate due to Fentanyl Overdose County: Marin

13.4
(2022)
Compared to:
Compared to CA Counties, Marin has a value of 13.4 which is in the best 50% of counties. Counties in the best 50% have a value lower than 14.8 while counties in the worst 25% have a value higher than 22.3.
CA Counties
The distribution is based on data from 58 California counties.
Compared to the CA Value (16.6), Marin has a value of 13.4 which is lower and better.
CA Value
(16.6)
The regional value is compared to the California state value.
Compared to the prior value, Marin (13.4) is less and better than the previously measured value (15.2).
Prior Value
(15.2)
Prior Value compares a measured value with the previously measured value. Confidence intervals were not taken into account in determining the direction of the comparison.
Over time, the Marin value is increasing, not significantly.
Trend
This comparison measures the indicator’s values over multiple time periods.<br>The Mann-Kendall Test for Statistical Significance is used to evaluate the trend<br>over 4 to 10 periods of measure, subject to data availability and comparability.

Health / Alcohol & Drug Use

Age-Adjusted Death Rate due to Heroin Overdose

Value
Compared to:

Health / Alcohol & Drug Use

Age-Adjusted Death Rate due to Heroin Overdose

Value
Compared to:

Age-Adjusted Death Rate due to Heroin Overdose County: Marin

Current Value:

Age-Adjusted Death Rate due to Heroin Overdose County: Marin

2.4
Deaths per 100,000 population
(2020)
Compared to:
Compared to CA Counties, Marin has a value of 2.4 which is in the 2nd worst quartile of counties. Counties in the best 50% have a value lower than 1.1 while counties in the worst 25% have a value higher than 2.6.
CA Counties
(2018)
The distribution is based on data from 58 California counties.
Compared to the CA Value (2.4), Marin has a value of 2.4.
CA Value
(2.4)
The regional value is compared to the California state value.
Compared to the prior value, Marin (2.4) is less and better than the previously measured value (3.7).
Prior Value
(3.7)
Prior Value compares a measured value with the previously measured value. Confidence intervals were not taken into account in determining the direction of the comparison.
Over time, the Marin value is increasing, not significantly.
Trend
This comparison measures the indicator’s values over multiple time periods.<br>The Mann-Kendall Test for Statistical Significance is used to evaluate the trend<br>over 4 to 10 periods of measure, subject to data availability and comparability.
Compared to the HP 2030 Target (4.2), the target has  been met.
HP 2030 Target
(4.2)

Health / Alcohol & Drug Use

Age-Adjusted Death Rate due to Prescription Opioid Overdose

Value
Compared to:

Health / Alcohol & Drug Use

Age-Adjusted Death Rate due to Prescription Opioid Overdose

Value
Compared to:

Age-Adjusted Death Rate due to Prescription Opioid Overdose County: Marin

Current Value:

Age-Adjusted Death Rate due to Prescription Opioid Overdose County: Marin

15.8
Rate per 100,000 residents
(2022)
Compared to:
Compared to CA Counties, Marin has a value of 15.8 which is in the best 50% of counties. Counties in the best 50% have a value lower than 16.6 while counties in the worst 25% have a value higher than 24.9.
CA Counties
The distribution is based on data from 58 California counties.
Compared to the CA Value (18.1), Marin has a value of 15.8 which is lower and better.
CA Value
(18.1)
The regional value is compared to the California state value.
Compared to the prior value, Marin (15.8) is less and better than the previously measured value (17.3).
Prior Value
(17.3)
Prior Value compares a measured value with the previously measured value. Confidence intervals were not taken into account in determining the direction of the comparison.
Over time, the Marin value is increasing significantly.
Trend
This comparison measures the indicator’s values over multiple time periods.<br>The Mann-Kendall Test for Statistical Significance is used to evaluate the trend<br>over 4 to 10 periods of measure, subject to data availability and comparability.

Age-Adjusted Death Rate due to Synthetic Opioid Overdose (excluding Methadone) County: Marin

Current Value:

Age-Adjusted Death Rate due to Synthetic Opioid Overdose (excluding Methadone) County: Marin

14.0
Rate per 100,000 residents
(2022)
Compared to:
Compared to CA Counties, Marin has a value of 14.0 which is in the best 50% of counties. Counties in the best 50% have a value lower than 14.8 while counties in the worst 25% have a value higher than 22.3.
CA Counties
The distribution is based on data from 58 California counties.
Compared to the CA Value (16.7), Marin has a value of 14.0 which is lower and better.
CA Value
(16.7)
The regional value is compared to the California state value.
Compared to the prior value, Marin (14.0) is less and better than the previously measured value (15.2).
Prior Value
(15.2)
Prior Value compares a measured value with the previously measured value. Confidence intervals were not taken into account in determining the direction of the comparison.
Over time, the Marin value is increasing significantly.
Trend
This comparison measures the indicator’s values over multiple time periods.<br>The Mann-Kendall Test for Statistical Significance is used to evaluate the trend<br>over 4 to 10 periods of measure, subject to data availability and comparability.
Compared to the HP 2030 Target (8.9), the target has not been met.
HP 2030 Target
(8.9)
<div>IVP-22: Reduce overdose deaths involving synthetic opioids other than methadone</div>

Health / Alcohol & Drug Use

Age-Adjusted Drug and Opioid-Involved Overdose Death Rate

Value
Compared to:

Health / Alcohol & Drug Use

Age-Adjusted Drug and Opioid-Involved Overdose Death Rate

Value
Compared to:

Age-Adjusted Drug and Opioid-Involved Overdose Death Rate County: Marin

Current Value:

Age-Adjusted Drug and Opioid-Involved Overdose Death Rate County: Marin

16.6
Deaths per 100,000 population
(2018-2020)
Compared to:
Compared to CA Counties, Marin has a value of 16.6 which is in the best 50% of counties. Counties in the best 50% have a value lower than 17.8 while counties in the worst 25% have a value higher than 22.0.
CA Counties
The distribution is based on data from 48 California counties.
Compared to U.S. Counties, Marin has a value of 16.6 which is in the best 50% of counties. Counties in the best 50% have a value lower than 25.3 while counties in the worst 25% have a value higher than 35.8.
U.S. Counties
The distribution is based on data from 1,303 U.S. counties and county equivalents.
Compared to the CA Value (16.5), Marin has a value of 16.6 which is higher and worse.
CA Value
(16.5)
The regional value is compared to the California state value.
Compared to the US Value (23.5), Marin has a value of 16.6 which is lower and better.
US Value
(23.5)
The regional value is compared to the national value.
Compared to the prior value, Marin (16.6) is not statistically different from the previously measured value (16.1).
Prior Value
(16.1)
Prior Value compares a measured value with the previously measured value. Confidence intervals were taken into account in determining the direction of the comparison.

Health / Alcohol & Drug Use

Age-Adjusted ED Visit Rate due to All Drug Overdose

Value
Compared to:

Health / Alcohol & Drug Use

Age-Adjusted ED Visit Rate due to All Drug Overdose

Value
Compared to:

Age-Adjusted ED Visit Rate due to All Drug Overdose County: Marin

Current Value:

Age-Adjusted ED Visit Rate due to All Drug Overdose County: Marin

123.4
Rate per 100,000 residents
(2022)
Compared to:
Compared to CA Counties, Marin has a value of 123.4 which is in the best 50% of counties. Counties in the best 50% have a value lower than 141.5 while counties in the worst 25% have a value higher than 183.3.
CA Counties
The distribution is based on data from 58 California counties.
Compared to the CA Value (143.7), Marin has a value of 123.4 which is lower and better.
CA Value
(143.7)
The regional value is compared to the California state value.
Compared to the prior value, Marin (123.4) is less and better than the previously measured value (152.3).
Prior Value
(152.3)
Prior Value compares a measured value with the previously measured value. Confidence intervals were not taken into account in determining the direction of the comparison.
Over time, the Marin value is increasing significantly.
Trend
This comparison measures the indicator’s values over multiple time periods.<br>The Mann-Kendall Test for Statistical Significance is used to evaluate the trend<br>over 4 to 10 periods of measure, subject to data availability and comparability.

Health / Alcohol & Drug Use

Age-Adjusted ED Visit Rate due to Heroin Overdose

Value
Compared to:

Health / Alcohol & Drug Use

Age-Adjusted ED Visit Rate due to Heroin Overdose

Value
Compared to:

Age-Adjusted ED Visit Rate due to Heroin Overdose County: Marin

Current Value:

Age-Adjusted ED Visit Rate due to Heroin Overdose County: Marin

3.2
Rate per 100,000 residents
(2022)
Compared to:
Compared to CA Counties, Marin has a value of 3.2 which is in the 2nd worst quartile of counties. Counties in the best 50% have a value lower than 3.1 while counties in the worst 25% have a value higher than 5.9.
CA Counties
The distribution is based on data from 58 California counties.
Compared to the CA Value (3.6), Marin has a value of 3.2 which is lower and better.
CA Value
(3.6)
The regional value is compared to the California state value.
Compared to the prior value, Marin (3.2) is greater and worse than the previously measured value (1.2).
Prior Value
(1.2)
Prior Value compares a measured value with the previously measured value. Confidence intervals were not taken into account in determining the direction of the comparison.
Over time, the Marin value is decreasing, not significantly.
Trend
This comparison measures the indicator’s values over multiple time periods.<br>The Mann-Kendall Test for Statistical Significance is used to evaluate the trend<br>over 4 to 10 periods of measure, subject to data availability and comparability.

Health / Alcohol & Drug Use

Age-Adjusted ED Visit Rate due to Opioid Overdose (excluding Heroin)

Value
Compared to:

Health / Alcohol & Drug Use

Age-Adjusted ED Visit Rate due to Opioid Overdose (excluding Heroin)

Value
Compared to:

Age-Adjusted ED Visit Rate due to Opioid Overdose (excluding Heroin) County: Marin

Current Value:

Age-Adjusted ED Visit Rate due to Opioid Overdose (excluding Heroin) County: Marin

30.8
Rate per 100,000 residents
(2022)
Compared to:
Compared to CA Counties, Marin has a value of 30.8 which is in the best 50% of counties. Counties in the best 50% have a value lower than 48.2 while counties in the worst 25% have a value higher than 70.0.
CA Counties
The distribution is based on data from 58 California counties.
Compared to the CA Value (54.9), Marin has a value of 30.8 which is lower and better.
CA Value
(54.9)
The regional value is compared to the California state value.
Compared to the prior value, Marin (30.8) is greater and worse than the previously measured value (11.5).
Prior Value
(11.5)
Prior Value compares a measured value with the previously measured value. Confidence intervals were not taken into account in determining the direction of the comparison.
Over time, the Marin value is increasing, not significantly.
Trend
This comparison measures the indicator’s values over multiple time periods.<br>The Mann-Kendall Test for Statistical Significance is used to evaluate the trend<br>over 4 to 10 periods of measure, subject to data availability and comparability.

Health / Alcohol & Drug Use

Age-Adjusted Hospitalization Rate due to All Drug Overdose

Value
Compared to:

Health / Alcohol & Drug Use

Age-Adjusted Hospitalization Rate due to All Drug Overdose

Value
Compared to:

Age-Adjusted Hospitalization Rate due to All Drug Overdose County: Marin

Current Value:

Age-Adjusted Hospitalization Rate due to All Drug Overdose County: Marin

35.6
Rate per 100,000 residents
(2022)
Compared to:
Compared to CA Counties, Marin has a value of 35.6 which is in the best 50% of counties. Counties in the best 50% have a value lower than 37.5 while counties in the worst 25% have a value higher than 45.9.
CA Counties
The distribution is based on data from 58 California counties.
Compared to the CA Value (48.3), Marin has a value of 35.6 which is lower and better.
CA Value
(48.3)
The regional value is compared to the California state value.
Compared to the prior value, Marin (35.6) is less and better than the previously measured value (46.7).
Prior Value
(46.7)
Prior Value compares a measured value with the previously measured value. Confidence intervals were not taken into account in determining the direction of the comparison.
Over time, the Marin value is decreasing, significantly.
Trend
This comparison measures the indicator’s values over multiple time periods.<br>The Mann-Kendall Test for Statistical Significance is used to evaluate the trend<br>over 4 to 10 periods of measure, subject to data availability and comparability.

Health / Alcohol & Drug Use

Age-Adjusted Hospitalization Rate due to Heroin Overdose

Value
Compared to:

Health / Alcohol & Drug Use

Age-Adjusted Hospitalization Rate due to Heroin Overdose

Value
Compared to:

Age-Adjusted Hospitalization Rate due to Heroin Overdose County: Marin

Current Value:

Age-Adjusted Hospitalization Rate due to Heroin Overdose County: Marin

0.2
Rate per 100,000 residents
(2022)
Compared to:
Compared to CA Counties, Marin has a value of 0.2 which is in the best 50% of counties. Counties in the best 50% have a value lower than 0.3 while counties in the worst 25% have a value higher than 0.8.
CA Counties
The distribution is based on data from 58 California counties.
Compared to the CA Value (0.7), Marin has a value of 0.2 which is lower and better.
CA Value
(0.7)
The regional value is compared to the California state value.
Compared to the prior value, Marin (0.2) is less and better than the previously measured value (1.2).
Prior Value
(1.2)
Prior Value compares a measured value with the previously measured value. Confidence intervals were not taken into account in determining the direction of the comparison.
Over time, the Marin value is decreasing, not significantly.
Trend
This comparison measures the indicator’s values over multiple time periods.<br>The Mann-Kendall Test for Statistical Significance is used to evaluate the trend<br>over 4 to 10 periods of measure, subject to data availability and comparability.

Age-Adjusted Hospitalization Rate due to Opioid Overdose (excluding Heroin) County: Marin

Current Value:

Age-Adjusted Hospitalization Rate due to Opioid Overdose (excluding Heroin) County: Marin

6.6
Rate per 100,000 residents
(2022)
Compared to:
Compared to CA Counties, Marin has a value of 6.6 which is in the best 50% of counties. Counties in the best 50% have a value lower than 8.0 while counties in the worst 25% have a value higher than 11.8.
CA Counties
The distribution is based on data from 58 California counties.
Compared to the CA Value (12.1), Marin has a value of 6.6 which is lower and better.
CA Value
(12.1)
The regional value is compared to the California state value.
Compared to the prior value, Marin (6.6) is less and better than the previously measured value (11.5).
Prior Value
(11.5)
Prior Value compares a measured value with the previously measured value. Confidence intervals were not taken into account in determining the direction of the comparison.
Over time, the Marin value is increasing, not significantly.
Trend
This comparison measures the indicator’s values over multiple time periods.<br>The Mann-Kendall Test for Statistical Significance is used to evaluate the trend<br>over 4 to 10 periods of measure, subject to data availability and comparability.

Age-Adjusted Long Acting or Extended Release Opioid Prescription Rate to Opioid Naive Residents County: Marin

Current Value:

Age-Adjusted Long Acting or Extended Release Opioid Prescription Rate to Opioid Naive Residents County: Marin

1.2
Per 100,000 population
(2022)
Compared to:
Compared to CA Counties, Marin has a value of 1.2 which is in the best 50% of counties. Counties in the best 50% have a value lower than 1.7 while counties in the worst 25% have a value higher than 2.4.
CA Counties
The distribution is based on data from 58 California counties.
Compared to the CA Value (1.2), Marin has a value of 1.2.
CA Value
(1.2)
The regional value is compared to the California state value.
Compared to the prior value, Marin (1.2) is not statistically different from the previously measured value (1.4).
Prior Value
(1.4)
Prior Value compares a measured value with the previously measured value. Confidence intervals were taken into account in determining the direction of the comparison.
Over time, the Marin value is decreasing, significantly.
Trend
This comparison measures the indicator’s values over multiple time periods.<br>The Mann-Kendall Test for Statistical Significance is used to evaluate the trend<br>over 4 to 10 periods of measure, subject to data availability and comparability.

Health / Alcohol & Drug Use

Death Rate due to Drug Poisoning

Value
Compared to:

Health / Alcohol & Drug Use

Death Rate due to Drug Poisoning

Value
Compared to:

Death Rate due to Drug Poisoning County: Marin

Current Value:

Death Rate due to Drug Poisoning County: Marin

21.0
Deaths per 100,000 population
(2019-2021)
Compared to:
Compared to CA Counties, Marin has a value of 21.0 which is in the best 50% of counties. Counties in the best 50% have a value lower than 22.5 while counties in the worst 25% have a value higher than 30.1.
CA Counties
The distribution is based on data from 54 California counties.
Compared to U.S. Counties, Marin has a value of 21.0 which is in the best 50% of counties. Counties in the best 50% have a value lower than 25.2 while counties in the worst 25% have a value higher than 35.8.
U.S. Counties
The distribution is based on data from 1,899 U.S. counties and county equivalents.
Compared to the CA Value (22.0), Marin has a value of 21.0 which is lower and better.
CA Value
(22.0)
The regional value is compared to the California state value.
Compared to the US Value (27.2), Marin has a value of 21.0 which is lower and better.
US Value
(27.2)
The regional value is compared to the national value.
Compared to the HP 2030 Target (20.7), the target has not been met.
HP 2030 Target
(20.7)
<div>SU-03: Reduce drug overdose deaths <strong>(LEADING HEALTH INDICATOR)</strong></div>

Health / Alcohol & Drug Use

Opioid Prescription Patients

Value
Compared to:

Health / Alcohol & Drug Use

Opioid Prescription Patients

Value
Compared to:

Opioid Prescription Patients County: Marin

Current Value:

Opioid Prescription Patients County: Marin

2.2%
(Q3 2022)
Compared to:
Compared to CA Counties, Marin has a value of 2.2% which is in the best 50% of counties. Counties in the best 50% have a value lower than 2.7% while counties in the worst 25% have a value higher than 3.6%.
CA Counties
The distribution is based on data from 58 California counties.
Compared to the prior value, Marin (2.2%) is not statistically different from the previously measured value (2.2%).
Prior Value
(2.2%)
Prior Value compares a measured value with the previously measured value. Confidence intervals were not taken into account in determining the direction of the comparison.
Over time, the Marin value is decreasing, significantly.
Trend
This comparison measures the indicator’s values over multiple time periods.<br>The Mann-Kendall Test for Statistical Significance is used to evaluate the trend<br>over 4 to 10 periods of measure, subject to data availability and comparability.

Opioid Prescription Patients Zip Code: Belvedere, Tiburon (94920)

Current Value:

Opioid Prescription Patients Zip Code: Belvedere, Tiburon (94920)

1.8%
(Q3 2022)
Compared to:
Compared to CA Zip Codes, Belvedere, Tiburon (94920) has a value of 1.8% which is in the best 50% of zip codes. Zip codes in the best 50% have a value lower than 2.3% while zip codes in the worst 25% have a value higher than 3.4%.
CA Zip Codes
The distribution is based on data from 1,736 California zip codes.
Compared to the Marin, CA County Value (2.2%), Belvedere, Tiburon (94920) has a value of 1.8% which is lower and better.
Marin, CA County Value
(2.2%)
The regional value is compared to the Marin County value.
Compared to the prior value, Belvedere, Tiburon (94920) (1.8%) is greater and worse than the previously measured value (1.7%).
Prior Value
(1.7%)
Prior Value compares a measured value with the previously measured value. Confidence intervals were not taken into account in determining the direction of the comparison.
Over time, the Belvedere, Tiburon (94920) value is decreasing, not significantly.
Trend
This comparison measures the indicator’s values over multiple time periods.<br>The Mann-Kendall Test for Statistical Significance is used to evaluate the trend<br>over 4 to 10 periods of measure, subject to data availability and comparability.

Opioid Prescription Patients Zip Code: Bolinas (94924)

Current Value:

Opioid Prescription Patients Zip Code: Bolinas (94924)

2.4%
(Q3 2022)
Compared to:
Compared to CA Zip Codes, Bolinas (94924) has a value of 2.4% which is in the 2nd worst quartile of zip codes. Zip codes in the best 50% have a value lower than 2.3% while zip codes in the worst 25% have a value higher than 3.4%.
CA Zip Codes
The distribution is based on data from 1,736 California zip codes.
Compared to the Marin, CA County Value (2.2%), Bolinas (94924) has a value of 2.4% which is higher and worse.
Marin, CA County Value
(2.2%)
The regional value is compared to the Marin County value.
Compared to the prior value, Bolinas (94924) (2.4%) is less and better than the previously measured value (2.5%).
Prior Value
(2.5%)
Prior Value compares a measured value with the previously measured value. Confidence intervals were not taken into account in determining the direction of the comparison.
Over time, the Bolinas (94924) value is increasing, not significantly.
Trend
This comparison measures the indicator’s values over multiple time periods.<br>The Mann-Kendall Test for Statistical Significance is used to evaluate the trend<br>over 4 to 10 periods of measure, subject to data availability and comparability.

Opioid Prescription Patients Zip Code: Corte Madera (94925)

Current Value:

Opioid Prescription Patients Zip Code: Corte Madera (94925)

2.0%
(Q3 2022)
Compared to:
Compared to CA Zip Codes, Corte Madera (94925) has a value of 2.0% which is in the best 50% of zip codes. Zip codes in the best 50% have a value lower than 2.3% while zip codes in the worst 25% have a value higher than 3.4%.
CA Zip Codes
The distribution is based on data from 1,736 California zip codes.
Compared to the Marin, CA County Value (2.2%), Corte Madera (94925) has a value of 2.0% which is lower and better.
Marin, CA County Value
(2.2%)
The regional value is compared to the Marin County value.
Compared to the prior value, Corte Madera (94925) (2.0%) is not statistically different from the previously measured value (2.0%).
Prior Value
(2.0%)
Prior Value compares a measured value with the previously measured value. Confidence intervals were not taken into account in determining the direction of the comparison.
Over time, the Corte Madera (94925) value is decreasing, significantly.
Trend
This comparison measures the indicator’s values over multiple time periods.<br>The Mann-Kendall Test for Statistical Significance is used to evaluate the trend<br>over 4 to 10 periods of measure, subject to data availability and comparability.

Opioid Prescription Patients Zip Code: Dillon Beach (94929)

Current Value:

Opioid Prescription Patients Zip Code: Dillon Beach (94929)

3.9%
(Q3 2022)
Compared to:
Compared to CA Zip Codes, Dillon Beach (94929) has a value of 3.9% which is in the worst 25% of zip codes. Zip codes in the best 50% have a value lower than 2.3% while zip codes in the worst 25% have a value higher than 3.4%.
CA Zip Codes
The distribution is based on data from 1,736 California zip codes.
Compared to the Marin, CA County Value (2.2%), Dillon Beach (94929) has a value of 3.9% which is higher and worse.
Marin, CA County Value
(2.2%)
The regional value is compared to the Marin County value.
Compared to the prior value, Dillon Beach (94929) (3.9%) is less and better than the previously measured value (4.6%).
Prior Value
(4.6%)
Prior Value compares a measured value with the previously measured value. Confidence intervals were not taken into account in determining the direction of the comparison.
Over time, the Dillon Beach (94929) value is decreasing, not significantly.
Trend
This comparison measures the indicator’s values over multiple time periods.<br>The Mann-Kendall Test for Statistical Significance is used to evaluate the trend<br>over 4 to 10 periods of measure, subject to data availability and comparability.

Opioid Prescription Patients Zip Code: Fairfax (94930)

Current Value:

Opioid Prescription Patients Zip Code: Fairfax (94930)

2.0%
(Q3 2022)
Compared to:
Compared to CA Zip Codes, Fairfax (94930) has a value of 2.0% which is in the best 50% of zip codes. Zip codes in the best 50% have a value lower than 2.3% while zip codes in the worst 25% have a value higher than 3.4%.
CA Zip Codes
The distribution is based on data from 1,736 California zip codes.
Compared to the Marin, CA County Value (2.2%), Fairfax (94930) has a value of 2.0% which is lower and better.
Marin, CA County Value
(2.2%)
The regional value is compared to the Marin County value.
Compared to the prior value, Fairfax (94930) (2.0%) is less and better than the previously measured value (2.1%).
Prior Value
(2.1%)
Prior Value compares a measured value with the previously measured value. Confidence intervals were not taken into account in determining the direction of the comparison.
Over time, the Fairfax (94930) value is decreasing, not significantly.
Trend
This comparison measures the indicator’s values over multiple time periods.<br>The Mann-Kendall Test for Statistical Significance is used to evaluate the trend<br>over 4 to 10 periods of measure, subject to data availability and comparability.

Opioid Prescription Patients Zip Code: Forest Knolls (94933)

Current Value:

Opioid Prescription Patients Zip Code: Forest Knolls (94933)

3.4%
(Q3 2022)
Compared to:
Compared to CA Zip Codes, Forest Knolls (94933) has a value of 3.4% which is in the worst 25% of zip codes. Zip codes in the best 50% have a value lower than 2.3% while zip codes in the worst 25% have a value higher than 3.4%.
CA Zip Codes
The distribution is based on data from 1,736 California zip codes.
Compared to the Marin, CA County Value (2.2%), Forest Knolls (94933) has a value of 3.4% which is higher and worse.
Marin, CA County Value
(2.2%)
The regional value is compared to the Marin County value.
Compared to the prior value, Forest Knolls (94933) (3.4%) is less and better than the previously measured value (4.1%).
Prior Value
(4.1%)
Prior Value compares a measured value with the previously measured value. Confidence intervals were not taken into account in determining the direction of the comparison.
Over time, the Forest Knolls (94933) value is decreasing, not significantly.
Trend
This comparison measures the indicator’s values over multiple time periods.<br>The Mann-Kendall Test for Statistical Significance is used to evaluate the trend<br>over 4 to 10 periods of measure, subject to data availability and comparability.

Opioid Prescription Patients Zip Code: Greenbrae, Kentfield (94904)

Current Value:

Opioid Prescription Patients Zip Code: Greenbrae, Kentfield (94904)

1.8%
(Q3 2022)
Compared to:
Compared to CA Zip Codes, Greenbrae, Kentfield (94904) has a value of 1.8% which is in the best 50% of zip codes. Zip codes in the best 50% have a value lower than 2.3% while zip codes in the worst 25% have a value higher than 3.4%.
CA Zip Codes
The distribution is based on data from 1,736 California zip codes.
Compared to the Marin, CA County Value (2.2%), Greenbrae, Kentfield (94904) has a value of 1.8% which is lower and better.
Marin, CA County Value
(2.2%)
The regional value is compared to the Marin County value.
Compared to the prior value, Greenbrae, Kentfield (94904) (1.8%) is less and better than the previously measured value (1.9%).
Prior Value
(1.9%)
Prior Value compares a measured value with the previously measured value. Confidence intervals were not taken into account in determining the direction of the comparison.
Over time, the Greenbrae, Kentfield (94904) value is decreasing, significantly.
Trend
This comparison measures the indicator’s values over multiple time periods.<br>The Mann-Kendall Test for Statistical Significance is used to evaluate the trend<br>over 4 to 10 periods of measure, subject to data availability and comparability.

Opioid Prescription Patients Zip Code: Inverness (94937)

Current Value:

Opioid Prescription Patients Zip Code: Inverness (94937)

2.9%
(Q3 2022)
Compared to:
Compared to CA Zip Codes, Inverness (94937) has a value of 2.9% which is in the 2nd worst quartile of zip codes. Zip codes in the best 50% have a value lower than 2.3% while zip codes in the worst 25% have a value higher than 3.4%.
CA Zip Codes
The distribution is based on data from 1,736 California zip codes.
Compared to the Marin, CA County Value (2.2%), Inverness (94937) has a value of 2.9% which is higher and worse.
Marin, CA County Value
(2.2%)
The regional value is compared to the Marin County value.
Compared to the prior value, Inverness (94937) (2.9%) is less and better than the previously measured value (3.2%).
Prior Value
(3.2%)
Prior Value compares a measured value with the previously measured value. Confidence intervals were not taken into account in determining the direction of the comparison.
Over time, the Inverness (94937) value is decreasing, not significantly.
Trend
This comparison measures the indicator’s values over multiple time periods.<br>The Mann-Kendall Test for Statistical Significance is used to evaluate the trend<br>over 4 to 10 periods of measure, subject to data availability and comparability.

Opioid Prescription Patients Zip Code: Lagunitas (94938)

Current Value:

Opioid Prescription Patients Zip Code: Lagunitas (94938)

2.0%
(Q3 2022)
Compared to:
Compared to CA Zip Codes, Lagunitas (94938) has a value of 2.0% which is in the best 50% of zip codes. Zip codes in the best 50% have a value lower than 2.3% while zip codes in the worst 25% have a value higher than 3.4%.
CA Zip Codes
The distribution is based on data from 1,736 California zip codes.
Compared to the Marin, CA County Value (2.2%), Lagunitas (94938) has a value of 2.0% which is lower and better.
Marin, CA County Value
(2.2%)
The regional value is compared to the Marin County value.
Compared to the prior value, Lagunitas (94938) (2.0%) is greater and worse than the previously measured value (1.8%).
Prior Value
(1.8%)
Prior Value compares a measured value with the previously measured value. Confidence intervals were not taken into account in determining the direction of the comparison.
Over time, the Lagunitas (94938) value is decreasing, significantly.
Trend
This comparison measures the indicator’s values over multiple time periods.<br>The Mann-Kendall Test for Statistical Significance is used to evaluate the trend<br>over 4 to 10 periods of measure, subject to data availability and comparability.

Opioid Prescription Patients Zip Code: Larkspur (94939)

Current Value:

Opioid Prescription Patients Zip Code: Larkspur (94939)

2.0%
(Q3 2022)
Compared to:
Compared to CA Zip Codes, Larkspur (94939) has a value of 2.0% which is in the best 50% of zip codes. Zip codes in the best 50% have a value lower than 2.3% while zip codes in the worst 25% have a value higher than 3.4%.
CA Zip Codes
The distribution is based on data from 1,736 California zip codes.
Compared to the Marin, CA County Value (2.2%), Larkspur (94939) has a value of 2.0% which is lower and better.
Marin, CA County Value
(2.2%)
The regional value is compared to the Marin County value.
Compared to the prior value, Larkspur (94939) (2.0%) is less and better than the previously measured value (2.1%).
Prior Value
(2.1%)
Prior Value compares a measured value with the previously measured value. Confidence intervals were not taken into account in determining the direction of the comparison.
Over time, the Larkspur (94939) value is increasing, not significantly.
Trend
This comparison measures the indicator’s values over multiple time periods.<br>The Mann-Kendall Test for Statistical Significance is used to evaluate the trend<br>over 4 to 10 periods of measure, subject to data availability and comparability.

Opioid Prescription Patients Zip Code: Marshall (94940)

Current Value:

Opioid Prescription Patients Zip Code: Marshall (94940)

1.9%
(Q3 2022)
Compared to:
Compared to CA Zip Codes, Marshall (94940) has a value of 1.9% which is in the best 50% of zip codes. Zip codes in the best 50% have a value lower than 2.3% while zip codes in the worst 25% have a value higher than 3.4%.
CA Zip Codes
The distribution is based on data from 1,736 California zip codes.
Compared to the Marin, CA County Value (2.2%), Marshall (94940) has a value of 1.9% which is lower and better.
Marin, CA County Value
(2.2%)
The regional value is compared to the Marin County value.
Compared to the prior value, Marshall (94940) (1.9%) is greater and worse than the previously measured value (1.7%).
Prior Value
(1.7%)
Prior Value compares a measured value with the previously measured value. Confidence intervals were not taken into account in determining the direction of the comparison.
Over time, the Marshall (94940) value is increasing, not significantly.
Trend
This comparison measures the indicator’s values over multiple time periods.<br>The Mann-Kendall Test for Statistical Significance is used to evaluate the trend<br>over 4 to 10 periods of measure, subject to data availability and comparability.

Opioid Prescription Patients Zip Code: Mill Valley (94941)

Current Value:

Opioid Prescription Patients Zip Code: Mill Valley (94941)

1.8%
(Q3 2022)
Compared to:
Compared to CA Zip Codes, Mill Valley (94941) has a value of 1.8% which is in the best 50% of zip codes. Zip codes in the best 50% have a value lower than 2.3% while zip codes in the worst 25% have a value higher than 3.4%.
CA Zip Codes
The distribution is based on data from 1,736 California zip codes.
Compared to the Marin, CA County Value (2.2%), Mill Valley (94941) has a value of 1.8% which is lower and better.
Marin, CA County Value
(2.2%)
The regional value is compared to the Marin County value.
Compared to the prior value, Mill Valley (94941) (1.8%) is not statistically different from the previously measured value (1.8%).
Prior Value
(1.8%)
Prior Value compares a measured value with the previously measured value. Confidence intervals were not taken into account in determining the direction of the comparison.
Over time, the Mill Valley (94941) value is decreasing, significantly.
Trend
This comparison measures the indicator’s values over multiple time periods.<br>The Mann-Kendall Test for Statistical Significance is used to evaluate the trend<br>over 4 to 10 periods of measure, subject to data availability and comparability.

Opioid Prescription Patients Zip Code: Muir Beach, Sausalito (94965)

Current Value:

Opioid Prescription Patients Zip Code: Muir Beach, Sausalito (94965)

2.1%
(Q3 2022)
Compared to:
Compared to CA Zip Codes, Muir Beach, Sausalito (94965) has a value of 2.1% which is in the best 50% of zip codes. Zip codes in the best 50% have a value lower than 2.3% while zip codes in the worst 25% have a value higher than 3.4%.
CA Zip Codes
The distribution is based on data from 1,736 California zip codes.
Compared to the Marin, CA County Value (2.2%), Muir Beach, Sausalito (94965) has a value of 2.1% which is lower and better.
Marin, CA County Value
(2.2%)
The regional value is compared to the Marin County value.
Compared to the prior value, Muir Beach, Sausalito (94965) (2.1%) is less and better than the previously measured value (2.3%).
Prior Value
(2.3%)
Prior Value compares a measured value with the previously measured value. Confidence intervals were not taken into account in determining the direction of the comparison.
Over time, the Muir Beach, Sausalito (94965) value is decreasing, significantly.
Trend
This comparison measures the indicator’s values over multiple time periods.<br>The Mann-Kendall Test for Statistical Significance is used to evaluate the trend<br>over 4 to 10 periods of measure, subject to data availability and comparability.

Opioid Prescription Patients Zip Code: Nicasio (94946)

Current Value:

Opioid Prescription Patients Zip Code: Nicasio (94946)

2.3%
(Q3 2022)
Compared to:
Compared to CA Zip Codes, Nicasio (94946) has a value of 2.3% which is in the best 50% of zip codes. Zip codes in the best 50% have a value lower than 2.3% while zip codes in the worst 25% have a value higher than 3.4%.
CA Zip Codes
The distribution is based on data from 1,736 California zip codes.
Compared to the Marin, CA County Value (2.2%), Nicasio (94946) has a value of 2.3% which is higher and worse.
Marin, CA County Value
(2.2%)
The regional value is compared to the Marin County value.
Compared to the prior value, Nicasio (94946) (2.3%) is greater and worse than the previously measured value (2.0%).
Prior Value
(2.0%)
Prior Value compares a measured value with the previously measured value. Confidence intervals were not taken into account in determining the direction of the comparison.
Over time, the Nicasio (94946) value is increasing, not significantly.
Trend
This comparison measures the indicator’s values over multiple time periods.<br>The Mann-Kendall Test for Statistical Significance is used to evaluate the trend<br>over 4 to 10 periods of measure, subject to data availability and comparability.

Opioid Prescription Patients Zip Code: Novato (94945)

Current Value:

Opioid Prescription Patients Zip Code: Novato (94945)

2.3%
(Q3 2022)
Compared to:
Compared to CA Zip Codes, Novato (94945) has a value of 2.3% which is in the best 50% of zip codes. Zip codes in the best 50% have a value lower than 2.3% while zip codes in the worst 25% have a value higher than 3.4%.
CA Zip Codes
The distribution is based on data from 1,736 California zip codes.
Compared to the Marin, CA County Value (2.2%), Novato (94945) has a value of 2.3% which is higher and worse.
Marin, CA County Value
(2.2%)
The regional value is compared to the Marin County value.
Compared to the prior value, Novato (94945) (2.3%) is not statistically different from the previously measured value (2.3%).
Prior Value
(2.3%)
Prior Value compares a measured value with the previously measured value. Confidence intervals were not taken into account in determining the direction of the comparison.
Over time, the Novato (94945) value is decreasing, not significantly.
Trend
This comparison measures the indicator’s values over multiple time periods.<br>The Mann-Kendall Test for Statistical Significance is used to evaluate the trend<br>over 4 to 10 periods of measure, subject to data availability and comparability.

Opioid Prescription Patients Zip Code: Novato (94947)

Current Value:

Opioid Prescription Patients Zip Code: Novato (94947)

2.7%
(Q3 2022)
Compared to:
Compared to CA Zip Codes, Novato (94947) has a value of 2.7% which is in the 2nd worst quartile of zip codes. Zip codes in the best 50% have a value lower than 2.3% while zip codes in the worst 25% have a value higher than 3.4%.
CA Zip Codes
The distribution is based on data from 1,736 California zip codes.
Compared to the Marin, CA County Value (2.2%), Novato (94947) has a value of 2.7% which is higher and worse.
Marin, CA County Value
(2.2%)
The regional value is compared to the Marin County value.
Compared to the prior value, Novato (94947) (2.7%) is not statistically different from the previously measured value (2.7%).
Prior Value
(2.7%)
Prior Value compares a measured value with the previously measured value. Confidence intervals were not taken into account in determining the direction of the comparison.
Over time, the Novato (94947) value is decreasing, significantly.
Trend
This comparison measures the indicator’s values over multiple time periods.<br>The Mann-Kendall Test for Statistical Significance is used to evaluate the trend<br>over 4 to 10 periods of measure, subject to data availability and comparability.

Opioid Prescription Patients Zip Code: Novato (94949)

Current Value:

Opioid Prescription Patients Zip Code: Novato (94949)

2.2%
(Q3 2022)
Compared to:
Compared to CA Zip Codes, Novato (94949) has a value of 2.2% which is in the best 50% of zip codes. Zip codes in the best 50% have a value lower than 2.3% while zip codes in the worst 25% have a value higher than 3.4%.
CA Zip Codes
The distribution is based on data from 1,736 California zip codes.
Compared to the Marin, CA County Value (2.2%), Novato (94949) has a value of 2.2%.
Marin, CA County Value
(2.2%)
The regional value is compared to the Marin County value.
Compared to the prior value, Novato (94949) (2.2%) is not statistically different from the previously measured value (2.2%).
Prior Value
(2.2%)
Prior Value compares a measured value with the previously measured value. Confidence intervals were not taken into account in determining the direction of the comparison.
Over time, the Novato (94949) value is decreasing, significantly.
Trend
This comparison measures the indicator’s values over multiple time periods.<br>The Mann-Kendall Test for Statistical Significance is used to evaluate the trend<br>over 4 to 10 periods of measure, subject to data availability and comparability.

Opioid Prescription Patients Zip Code: Olema (94950)

Current Value:

Opioid Prescription Patients Zip Code: Olema (94950)

1.4%
(Q3 2022)
Compared to:
Compared to CA Zip Codes, Olema (94950) has a value of 1.4% which is in the best 50% of zip codes. Zip codes in the best 50% have a value lower than 2.3% while zip codes in the worst 25% have a value higher than 3.4%.
CA Zip Codes
The distribution is based on data from 1,736 California zip codes.
Compared to the Marin, CA County Value (2.2%), Olema (94950) has a value of 1.4% which is lower and better.
Marin, CA County Value
(2.2%)
The regional value is compared to the Marin County value.
Compared to the prior value, Olema (94950) (1.4%) is not statistically different from the previously measured value (1.4%).
Prior Value
(1.4%)
Prior Value compares a measured value with the previously measured value. Confidence intervals were not taken into account in determining the direction of the comparison.
Over time, the Olema (94950) value is decreasing, significantly.
Trend
This comparison measures the indicator’s values over multiple time periods.<br>The Mann-Kendall Test for Statistical Significance is used to evaluate the trend<br>over 4 to 10 periods of measure, subject to data availability and comparability.

Opioid Prescription Patients Zip Code: Point Reyes Station (94956)

Current Value:

Opioid Prescription Patients Zip Code: Point Reyes Station (94956)

2.5%
(Q3 2022)
Compared to:
Compared to CA Zip Codes, Point Reyes Station (94956) has a value of 2.5% which is in the 2nd worst quartile of zip codes. Zip codes in the best 50% have a value lower than 2.3% while zip codes in the worst 25% have a value higher than 3.4%.
CA Zip Codes
The distribution is based on data from 1,736 California zip codes.
Compared to the Marin, CA County Value (2.2%), Point Reyes Station (94956) has a value of 2.5% which is higher and worse.
Marin, CA County Value
(2.2%)
The regional value is compared to the Marin County value.
Compared to the prior value, Point Reyes Station (94956) (2.5%) is less and better than the previously measured value (2.9%).
Prior Value
(2.9%)
Prior Value compares a measured value with the previously measured value. Confidence intervals were not taken into account in determining the direction of the comparison.
Over time, the Point Reyes Station (94956) value is increasing, not significantly.
Trend
This comparison measures the indicator’s values over multiple time periods.<br>The Mann-Kendall Test for Statistical Significance is used to evaluate the trend<br>over 4 to 10 periods of measure, subject to data availability and comparability.
Healthy Marin