
Indicator Gauge Icon Legend
Legend Colors
Red is bad, green is good, blue is not statistically different/neutral.
Compared to Distribution
 the value is in the best half of communities.
 the value is in the 2nd worst quarter of communities.
 the value is in the worst quarter of communities.
Compared to Target
 meets target;
  does not meet target.
Compared to a Single Value
 lower than the comparison value;
 higher than the comparison value;
 not statistically different from comparison value.
Trend

 non-significant change over time;
 significant change over time;
  no change over time.
Compared to Prior Value
 higher than the previous measurement period;
 lower than the previous measurement period;
 no statistically different change from previous measurement period.
 Significantly better than the overall value
 Significantly worse than the overall value
 No significant difference with the overall value
 No data on significance available
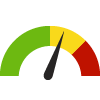
Beach Water Quality
Measurement Period: 2013
This indicator is archived and is no longer being updated. Click to learn more
This indicator shows the percent of water samples collected from beaches that exceeded health standards.
Why is this important?
An exceedance of national or state standards indicates the presence of pathogenic organisms. The key known contributors of these contaminants are untreated or partially treated discharges from sewage treatment plants or sanitary sewers, rain or stormwater that carries agricultural and municipal wastes, septic system failures, and wildlife droppings. Pathogens found in recreational water can cause a wide variety of acute illnesses, including gastroenteritis, respiratory infection, diarrhea, ear infection and others.
Incidence of infections associated with recreational water use has steadily increased over the past several decades.
Incidence of infections associated with recreational water use has steadily increased over the past several decades.
County: Marin
4%
Source:
Natural Resources Defense Council
Measurement period: 2013
Maintained by: Conduent Healthy Communities Institute
Last update: July 2014
Measurement period: 2013
Maintained by: Conduent Healthy Communities Institute
Last update: July 2014
Compared to
Graph Selections

Data Source
- Natural Resources Defense Council
Maintained By: Conduent Healthy Communities Institute (Methodology)
Filed under: Environmental Health / Toxins & Contaminants, Physical Determinants of Health