
Advanced Search: Build a Custom Dashboard
In the fields below, search for indicators by location, topics, population, classification, subgroup, or comparison. No fields are required, but we suggest selecting a location or two to start. In the additional search options section, select options to group and order search results. To learn more about how to customize a dashboard, see our help center.
Visit the Indicator List Page to see the full list of indicators and locations available on the site.
Search Results:
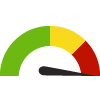
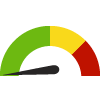
Indicator Gauge Icon Legend
Legend Colors
Red is bad, green is good, blue is not statistically different/neutral.
Compared to Distribution
 the value is in the best half of communities.
 the value is in the 2nd worst quarter of communities.
 the value is in the worst quarter of communities.
Compared to Target
 meets target;
  does not meet target.
Compared to a Single Value
 lower than the comparison value;
 higher than the comparison value;
 not statistically different from comparison value.
Trend

 non-significant change over time;
 significant change over time;
  no change over time.
Compared to Prior Value
 higher than the previous measurement period;
 lower than the previous measurement period;
 no statistically different change from previous measurement period.
Economy / Poverty
Youth not in School or Working Census Place: Nicasio
Youth not in School or Working Census Place: Nicasio
0.0%
(2018-2022)
Compared to:
CA Census Places
(2017-2021)
The distribution is based on data from 1,258 locales.
U.S. Census Places
(2015-2019)
The distribution is based on data from 26,145 U.S. Census Places.
Marin, CA County Value
(0.2%)
The regional value is compared to the Marin County value.
CA Value
(1.5%)
The regional value is compared to the California state value.
US Value
(1.8%)
The regional value is compared to the national value.
Trend
This comparison measures the indicator’s values over multiple time periods.<br>The Mann-Kendall Test for Statistical Significance is used to evaluate the trend<br>over 4 to 10 periods of measure, subject to data availability and comparability.
Youth not in School or Working Census Place: Novato
Youth not in School or Working Census Place: Novato
1.0%
(2018-2022)
Compared to:

CA Census Places
(2017-2021)
The distribution is based on data from 1,258 locales.
U.S. Census Places
(2015-2019)
The distribution is based on data from 26,145 U.S. Census Places.
Marin, CA County Value
(0.2%)
The regional value is compared to the Marin County value.
CA Value
(1.5%)
The regional value is compared to the California state value.
US Value
(1.8%)
The regional value is compared to the national value.
Trend
This comparison measures the indicator’s values over multiple time periods.<br>The Mann-Kendall Test for Statistical Significance is used to evaluate the trend<br>over 4 to 10 periods of measure, subject to data availability and comparability.
Youth not in School or Working Census Place: Ross
Youth not in School or Working Census Place: Ross
0.0%
(2018-2022)
Compared to:
CA Census Places
(2017-2021)
The distribution is based on data from 1,258 locales.
U.S. Census Places
(2015-2019)
The distribution is based on data from 26,145 U.S. Census Places.
Marin, CA County Value
(0.2%)
The regional value is compared to the Marin County value.
CA Value
(1.5%)
The regional value is compared to the California state value.
US Value
(1.8%)
The regional value is compared to the national value.
Trend
This comparison measures the indicator’s values over multiple time periods.<br>The Mann-Kendall Test for Statistical Significance is used to evaluate the trend<br>over 4 to 10 periods of measure, subject to data availability and comparability.
Youth not in School or Working Census Place: San Anselmo
Youth not in School or Working Census Place: San Anselmo
0.0%
(2018-2022)
Compared to:
CA Census Places
(2017-2021)
The distribution is based on data from 1,258 locales.
U.S. Census Places
(2015-2019)
The distribution is based on data from 26,145 U.S. Census Places.
Marin, CA County Value
(0.2%)
The regional value is compared to the Marin County value.
CA Value
(1.5%)
The regional value is compared to the California state value.
US Value
(1.8%)
The regional value is compared to the national value.
Trend
This comparison measures the indicator’s values over multiple time periods.<br>The Mann-Kendall Test for Statistical Significance is used to evaluate the trend<br>over 4 to 10 periods of measure, subject to data availability and comparability.
Youth not in School or Working Census Place: San Geronimo
Youth not in School or Working Census Place: San Geronimo
0.0%
(2018-2022)
Compared to:
CA Census Places
(2017-2021)
The distribution is based on data from 1,258 locales.
U.S. Census Places
(2015-2019)
The distribution is based on data from 26,145 U.S. Census Places.
Marin, CA County Value
(0.2%)
The regional value is compared to the Marin County value.
CA Value
(1.5%)
The regional value is compared to the California state value.
US Value
(1.8%)
The regional value is compared to the national value.
Youth not in School or Working Census Place: San Rafael
Youth not in School or Working Census Place: San Rafael
0.0%
(2018-2022)
Compared to:
CA Census Places
(2017-2021)
The distribution is based on data from 1,258 locales.
U.S. Census Places
(2015-2019)
The distribution is based on data from 26,145 U.S. Census Places.
Marin, CA County Value
(0.2%)
The regional value is compared to the Marin County value.
CA Value
(1.5%)
The regional value is compared to the California state value.
US Value
(1.8%)
The regional value is compared to the national value.
Trend
This comparison measures the indicator’s values over multiple time periods.<br>The Mann-Kendall Test for Statistical Significance is used to evaluate the trend<br>over 4 to 10 periods of measure, subject to data availability and comparability.
Youth not in School or Working Census Place: Santa Venetia
Youth not in School or Working Census Place: Santa Venetia
0.0%
(2018-2022)
Compared to:
CA Census Places
(2017-2021)
The distribution is based on data from 1,258 locales.
U.S. Census Places
(2015-2019)
The distribution is based on data from 26,145 U.S. Census Places.
Marin, CA County Value
(0.2%)
The regional value is compared to the Marin County value.
CA Value
(1.5%)
The regional value is compared to the California state value.
US Value
(1.8%)
The regional value is compared to the national value.
Trend
This comparison measures the indicator’s values over multiple time periods.<br>The Mann-Kendall Test for Statistical Significance is used to evaluate the trend<br>over 4 to 10 periods of measure, subject to data availability and comparability.
Youth not in School or Working Census Place: Sausalito
Youth not in School or Working Census Place: Sausalito
0.0%
(2018-2022)
Compared to:
CA Census Places
(2017-2021)
The distribution is based on data from 1,258 locales.
U.S. Census Places
(2015-2019)
The distribution is based on data from 26,145 U.S. Census Places.
Marin, CA County Value
(0.2%)
The regional value is compared to the Marin County value.
CA Value
(1.5%)
The regional value is compared to the California state value.
US Value
(1.8%)
The regional value is compared to the national value.
Trend
This comparison measures the indicator’s values over multiple time periods.<br>The Mann-Kendall Test for Statistical Significance is used to evaluate the trend<br>over 4 to 10 periods of measure, subject to data availability and comparability.
Youth not in School or Working Census Place: Sleepy Hollow
Youth not in School or Working Census Place: Sleepy Hollow
0.0%
(2018-2022)
Compared to:
CA Census Places
(2017-2021)
The distribution is based on data from 1,258 locales.
U.S. Census Places
(2015-2019)
The distribution is based on data from 26,145 U.S. Census Places.
Marin, CA County Value
(0.2%)
The regional value is compared to the Marin County value.
CA Value
(1.5%)
The regional value is compared to the California state value.
US Value
(1.8%)
The regional value is compared to the national value.
Trend
This comparison measures the indicator’s values over multiple time periods.<br>The Mann-Kendall Test for Statistical Significance is used to evaluate the trend<br>over 4 to 10 periods of measure, subject to data availability and comparability.
Youth not in School or Working Census Place: Stinson Beach
Youth not in School or Working Census Place: Stinson Beach
0.0%
(2017-2021)
Compared to:
CA Census Places
The distribution is based on data from 1,258 locales.
U.S. Census Places
(2015-2019)
The distribution is based on data from 26,145 U.S. Census Places.
Marin, CA County Value
(4.6%)
The regional value is compared to the Marin County value.
CA Value
(6.6%)
The regional value is compared to the California state value.
US Value
(6.9%)
The regional value is compared to the national value.
Trend
This comparison measures the indicator’s values over multiple time periods.<br>The Mann-Kendall Test for Statistical Significance is used to evaluate the trend<br>over 4 to 10 periods of measure, subject to data availability and comparability.
Youth not in School or Working Census Place: Strawberry
Youth not in School or Working Census Place: Strawberry
0.0%
(2018-2022)
Compared to:
CA Census Places
(2017-2021)
The distribution is based on data from 1,258 locales.
U.S. Census Places
(2015-2019)
The distribution is based on data from 26,145 U.S. Census Places.
Marin, CA County Value
(0.2%)
The regional value is compared to the Marin County value.
CA Value
(1.5%)
The regional value is compared to the California state value.
US Value
(1.8%)
The regional value is compared to the national value.
Trend
This comparison measures the indicator’s values over multiple time periods.<br>The Mann-Kendall Test for Statistical Significance is used to evaluate the trend<br>over 4 to 10 periods of measure, subject to data availability and comparability.
Youth not in School or Working Census Place: Tamalpais-Homestead Valley
Youth not in School or Working Census Place: Tamalpais-Homestead Valley
0.0%
(2018-2022)
Compared to:
CA Census Places
(2017-2021)
The distribution is based on data from 1,258 locales.
U.S. Census Places
(2015-2019)
The distribution is based on data from 26,145 U.S. Census Places.
Marin, CA County Value
(0.2%)
The regional value is compared to the Marin County value.
CA Value
(1.5%)
The regional value is compared to the California state value.
US Value
(1.8%)
The regional value is compared to the national value.
Trend
This comparison measures the indicator’s values over multiple time periods.<br>The Mann-Kendall Test for Statistical Significance is used to evaluate the trend<br>over 4 to 10 periods of measure, subject to data availability and comparability.
Youth not in School or Working Census Place: Tiburon
Youth not in School or Working Census Place: Tiburon
0.0%
(2018-2022)
Compared to:
CA Census Places
(2017-2021)
The distribution is based on data from 1,258 locales.
U.S. Census Places
(2015-2019)
The distribution is based on data from 26,145 U.S. Census Places.
Marin, CA County Value
(0.2%)
The regional value is compared to the Marin County value.
CA Value
(1.5%)
The regional value is compared to the California state value.
US Value
(1.8%)
The regional value is compared to the national value.
Trend
This comparison measures the indicator’s values over multiple time periods.<br>The Mann-Kendall Test for Statistical Significance is used to evaluate the trend<br>over 4 to 10 periods of measure, subject to data availability and comparability.
Youth not in School or Working Census Place: Woodacre
Youth not in School or Working Census Place: Woodacre
0.0%
(2018-2022)
Compared to:
CA Census Places
(2017-2021)
The distribution is based on data from 1,258 locales.
U.S. Census Places
(2015-2019)
The distribution is based on data from 26,145 U.S. Census Places.
Marin, CA County Value
(0.2%)
The regional value is compared to the Marin County value.
CA Value
(1.5%)
The regional value is compared to the California state value.
US Value
(1.8%)
The regional value is compared to the national value.
Trend
This comparison measures the indicator’s values over multiple time periods.<br>The Mann-Kendall Test for Statistical Significance is used to evaluate the trend<br>over 4 to 10 periods of measure, subject to data availability and comparability.
Youth not in School or Working Zip Code: Belvedere, Tiburon (94920)
Youth not in School or Working Zip Code: Belvedere, Tiburon (94920)
0.0%
(2018-2022)
Compared to:
CA Zip Codes
(2017-2021)
The distribution is based on data from 1,601 California zip codes.
U.S. Zip Codes
(2017-2021)
The distribution is based on data from 29,979 U.S. zip codes.
Marin, CA County Value
(0.2%)
The regional value is compared to the Marin County value.
Trend
This comparison measures the indicator’s values over multiple time periods.<br>The Mann-Kendall Test for Statistical Significance is used to evaluate the trend<br>over 4 to 10 periods of measure, subject to data availability and comparability.
Youth not in School or Working Zip Code: Bolinas (94924)
Youth not in School or Working Zip Code: Bolinas (94924)
0.0%
(2016-2020)
Compared to:
CA Zip Codes
The distribution is based on data from 1,580 California zip codes.
U.S. Zip Codes
The distribution is based on data from 29,859 U.S. zip codes.
Marin, CA County Value
(6.6%)
The regional value is compared to the Marin County value.
Youth not in School or Working Zip Code: Corte Madera (94925)
Youth not in School or Working Zip Code: Corte Madera (94925)
0.0%
(2018-2022)
Compared to:
CA Zip Codes
(2017-2021)
The distribution is based on data from 1,601 California zip codes.
U.S. Zip Codes
(2017-2021)
The distribution is based on data from 29,979 U.S. zip codes.
Marin, CA County Value
(0.2%)
The regional value is compared to the Marin County value.
Trend
This comparison measures the indicator’s values over multiple time periods.<br>The Mann-Kendall Test for Statistical Significance is used to evaluate the trend<br>over 4 to 10 periods of measure, subject to data availability and comparability.
Youth not in School or Working Zip Code: Fairfax (94930)
Youth not in School or Working Zip Code: Fairfax (94930)
0.0%
(2018-2022)
Compared to:
CA Zip Codes
(2017-2021)
The distribution is based on data from 1,601 California zip codes.
U.S. Zip Codes
(2017-2021)
The distribution is based on data from 29,979 U.S. zip codes.
Marin, CA County Value
(0.2%)
The regional value is compared to the Marin County value.
Trend
This comparison measures the indicator’s values over multiple time periods.<br>The Mann-Kendall Test for Statistical Significance is used to evaluate the trend<br>over 4 to 10 periods of measure, subject to data availability and comparability.
Youth not in School or Working Zip Code: Forest Knolls (94933)
Youth not in School or Working Zip Code: Forest Knolls (94933)
0.0%
(2018-2022)
Compared to:
CA Zip Codes
(2017-2021)
The distribution is based on data from 1,601 California zip codes.
U.S. Zip Codes
(2017-2021)
The distribution is based on data from 29,979 U.S. zip codes.
Marin, CA County Value
(0.2%)
The regional value is compared to the Marin County value.
Trend
This comparison measures the indicator’s values over multiple time periods.<br>The Mann-Kendall Test for Statistical Significance is used to evaluate the trend<br>over 4 to 10 periods of measure, subject to data availability and comparability.
Youth not in School or Working Zip Code: Greenbrae, Kentfield (94904)
Youth not in School or Working Zip Code: Greenbrae, Kentfield (94904)
0.0%
(2018-2022)
Compared to:
CA Zip Codes
(2017-2021)
The distribution is based on data from 1,601 California zip codes.
U.S. Zip Codes
(2017-2021)
The distribution is based on data from 29,979 U.S. zip codes.
Marin, CA County Value
(0.2%)
The regional value is compared to the Marin County value.
Trend
This comparison measures the indicator’s values over multiple time periods.<br>The Mann-Kendall Test for Statistical Significance is used to evaluate the trend<br>over 4 to 10 periods of measure, subject to data availability and comparability.
Youth not in School or Working Zip Code: Inverness (94937)
Youth not in School or Working Zip Code: Inverness (94937)
0.0%
(2017-2021)
Compared to:
CA Zip Codes
The distribution is based on data from 1,601 California zip codes.
U.S. Zip Codes
The distribution is based on data from 29,979 U.S. zip codes.
Marin, CA County Value
(4.6%)
The regional value is compared to the Marin County value.
Trend
This comparison measures the indicator’s values over multiple time periods.<br>The Mann-Kendall Test for Statistical Significance is used to evaluate the trend<br>over 4 to 10 periods of measure, subject to data availability and comparability.
Youth not in School or Working Zip Code: Lagunitas (94938)
Youth not in School or Working Zip Code: Lagunitas (94938)
0.0%
(2018-2022)
Compared to:
CA Zip Codes
(2017-2021)
The distribution is based on data from 1,601 California zip codes.
U.S. Zip Codes
(2017-2021)
The distribution is based on data from 29,979 U.S. zip codes.
Marin, CA County Value
(0.2%)
The regional value is compared to the Marin County value.
Trend
This comparison measures the indicator’s values over multiple time periods.<br>The Mann-Kendall Test for Statistical Significance is used to evaluate the trend<br>over 4 to 10 periods of measure, subject to data availability and comparability.
Youth not in School or Working Zip Code: Larkspur (94939)
Youth not in School or Working Zip Code: Larkspur (94939)
0.0%
(2018-2022)
Compared to:
CA Zip Codes
(2017-2021)
The distribution is based on data from 1,601 California zip codes.
U.S. Zip Codes
(2017-2021)
The distribution is based on data from 29,979 U.S. zip codes.
Marin, CA County Value
(0.2%)
The regional value is compared to the Marin County value.
Trend
This comparison measures the indicator’s values over multiple time periods.<br>The Mann-Kendall Test for Statistical Significance is used to evaluate the trend<br>over 4 to 10 periods of measure, subject to data availability and comparability.
Youth not in School or Working Zip Code: Marshall (94940)
Youth not in School or Working Zip Code: Marshall (94940)
0.0%
(2018-2022)
Compared to:
CA Zip Codes
(2017-2021)
The distribution is based on data from 1,601 California zip codes.
U.S. Zip Codes
(2017-2021)
The distribution is based on data from 29,979 U.S. zip codes.
Marin, CA County Value
(0.2%)
The regional value is compared to the Marin County value.
Trend
This comparison measures the indicator’s values over multiple time periods.<br>The Mann-Kendall Test for Statistical Significance is used to evaluate the trend<br>over 4 to 10 periods of measure, subject to data availability and comparability.
Youth not in School or Working Zip Code: Mill Valley (94941)
Youth not in School or Working Zip Code: Mill Valley (94941)
0.0%
(2018-2022)
Compared to:
CA Zip Codes
(2017-2021)
The distribution is based on data from 1,601 California zip codes.
U.S. Zip Codes
(2017-2021)
The distribution is based on data from 29,979 U.S. zip codes.
Marin, CA County Value
(0.2%)
The regional value is compared to the Marin County value.
Trend
This comparison measures the indicator’s values over multiple time periods.<br>The Mann-Kendall Test for Statistical Significance is used to evaluate the trend<br>over 4 to 10 periods of measure, subject to data availability and comparability.
Youth not in School or Working Zip Code: Muir Beach, Sausalito (94965)
Youth not in School or Working Zip Code: Muir Beach, Sausalito (94965)
0.0%
(2018-2022)
Compared to:
CA Zip Codes
(2017-2021)
The distribution is based on data from 1,601 California zip codes.
U.S. Zip Codes
(2017-2021)
The distribution is based on data from 29,979 U.S. zip codes.
Marin, CA County Value
(0.2%)
The regional value is compared to the Marin County value.
Trend
This comparison measures the indicator’s values over multiple time periods.<br>The Mann-Kendall Test for Statistical Significance is used to evaluate the trend<br>over 4 to 10 periods of measure, subject to data availability and comparability.
Youth not in School or Working Zip Code: Nicasio (94946)
Youth not in School or Working Zip Code: Nicasio (94946)
0.0%
(2018-2022)
Compared to:
CA Zip Codes
(2017-2021)
The distribution is based on data from 1,601 California zip codes.
U.S. Zip Codes
(2017-2021)
The distribution is based on data from 29,979 U.S. zip codes.
Marin, CA County Value
(0.2%)
The regional value is compared to the Marin County value.
Trend
This comparison measures the indicator’s values over multiple time periods.<br>The Mann-Kendall Test for Statistical Significance is used to evaluate the trend<br>over 4 to 10 periods of measure, subject to data availability and comparability.
Youth not in School or Working Zip Code: Novato (94945)
Youth not in School or Working Zip Code: Novato (94945)
0.0%
(2018-2022)
Compared to:
CA Zip Codes
(2017-2021)
The distribution is based on data from 1,601 California zip codes.
U.S. Zip Codes
(2017-2021)
The distribution is based on data from 29,979 U.S. zip codes.
Marin, CA County Value
(0.2%)
The regional value is compared to the Marin County value.
Trend
This comparison measures the indicator’s values over multiple time periods.<br>The Mann-Kendall Test for Statistical Significance is used to evaluate the trend<br>over 4 to 10 periods of measure, subject to data availability and comparability.
Youth not in School or Working Zip Code: Novato (94947)
Youth not in School or Working Zip Code: Novato (94947)
1.8%
(2018-2022)
Compared to:

CA Zip Codes
(2017-2021)
The distribution is based on data from 1,601 California zip codes.
U.S. Zip Codes
(2017-2021)
The distribution is based on data from 29,979 U.S. zip codes.
Marin, CA County Value
(0.2%)
The regional value is compared to the Marin County value.
Trend
This comparison measures the indicator’s values over multiple time periods.<br>The Mann-Kendall Test for Statistical Significance is used to evaluate the trend<br>over 4 to 10 periods of measure, subject to data availability and comparability.
Youth not in School or Working Zip Code: Novato (94949)
Youth not in School or Working Zip Code: Novato (94949)
0.0%
(2018-2022)
Compared to:
CA Zip Codes
(2017-2021)
The distribution is based on data from 1,601 California zip codes.
U.S. Zip Codes
(2017-2021)
The distribution is based on data from 29,979 U.S. zip codes.
Marin, CA County Value
(0.2%)
The regional value is compared to the Marin County value.
Trend
This comparison measures the indicator’s values over multiple time periods.<br>The Mann-Kendall Test for Statistical Significance is used to evaluate the trend<br>over 4 to 10 periods of measure, subject to data availability and comparability.
Youth not in School or Working Zip Code: Olema (94950)
Youth not in School or Working Zip Code: Olema (94950)
0.0%
(2016-2020)
Compared to:
CA Zip Codes
The distribution is based on data from 1,580 California zip codes.
U.S. Zip Codes
The distribution is based on data from 29,859 U.S. zip codes.
Marin, CA County Value
(6.6%)
The regional value is compared to the Marin County value.
Youth not in School or Working Zip Code: Point Reyes Station (94956)
Youth not in School or Working Zip Code: Point Reyes Station (94956)
0.0%
(2018-2022)
Compared to:
CA Zip Codes
(2017-2021)
The distribution is based on data from 1,601 California zip codes.
U.S. Zip Codes
(2017-2021)
The distribution is based on data from 29,979 U.S. zip codes.
Marin, CA County Value
(0.2%)
The regional value is compared to the Marin County value.
Trend
This comparison measures the indicator’s values over multiple time periods.<br>The Mann-Kendall Test for Statistical Significance is used to evaluate the trend<br>over 4 to 10 periods of measure, subject to data availability and comparability.
Youth not in School or Working Zip Code: Ross (94957)
Youth not in School or Working Zip Code: Ross (94957)
0.0%
(2018-2022)
Compared to:
CA Zip Codes
(2017-2021)
The distribution is based on data from 1,601 California zip codes.
U.S. Zip Codes
(2017-2021)
The distribution is based on data from 29,979 U.S. zip codes.
Marin, CA County Value
(0.2%)
The regional value is compared to the Marin County value.
Trend
This comparison measures the indicator’s values over multiple time periods.<br>The Mann-Kendall Test for Statistical Significance is used to evaluate the trend<br>over 4 to 10 periods of measure, subject to data availability and comparability.
Youth not in School or Working Zip Code: San Anselmo (94960)
Youth not in School or Working Zip Code: San Anselmo (94960)
0.0%
(2018-2022)
Compared to:
CA Zip Codes
(2017-2021)
The distribution is based on data from 1,601 California zip codes.
U.S. Zip Codes
(2017-2021)
The distribution is based on data from 29,979 U.S. zip codes.
Marin, CA County Value
(0.2%)
The regional value is compared to the Marin County value.
Trend
This comparison measures the indicator’s values over multiple time periods.<br>The Mann-Kendall Test for Statistical Significance is used to evaluate the trend<br>over 4 to 10 periods of measure, subject to data availability and comparability.
Youth not in School or Working Zip Code: San Geronimo (94963)
Youth not in School or Working Zip Code: San Geronimo (94963)
0.0%
(2018-2022)
Compared to:
CA Zip Codes
(2017-2021)
The distribution is based on data from 1,601 California zip codes.
U.S. Zip Codes
(2017-2021)
The distribution is based on data from 29,979 U.S. zip codes.
Marin, CA County Value
(0.2%)
The regional value is compared to the Marin County value.
Youth not in School or Working Zip Code: San Quentin (94964)
Youth not in School or Working Zip Code: San Quentin (94964)
0.0%
(2018-2022)
Compared to:
CA Zip Codes
(2017-2021)
The distribution is based on data from 1,601 California zip codes.
U.S. Zip Codes
(2017-2021)
The distribution is based on data from 29,979 U.S. zip codes.
Marin, CA County Value
(0.2%)
The regional value is compared to the Marin County value.
Trend
This comparison measures the indicator’s values over multiple time periods.<br>The Mann-Kendall Test for Statistical Significance is used to evaluate the trend<br>over 4 to 10 periods of measure, subject to data availability and comparability.
Youth not in School or Working Zip Code: San Rafael (94901)
Youth not in School or Working Zip Code: San Rafael (94901)
0.0%
(2018-2022)
Compared to:
CA Zip Codes
(2017-2021)
The distribution is based on data from 1,601 California zip codes.
U.S. Zip Codes
(2017-2021)
The distribution is based on data from 29,979 U.S. zip codes.
Marin, CA County Value
(0.2%)
The regional value is compared to the Marin County value.
Trend
This comparison measures the indicator’s values over multiple time periods.<br>The Mann-Kendall Test for Statistical Significance is used to evaluate the trend<br>over 4 to 10 periods of measure, subject to data availability and comparability.
Youth not in School or Working Zip Code: San Rafael (94903)
Youth not in School or Working Zip Code: San Rafael (94903)
0.0%
(2018-2022)
Compared to:
CA Zip Codes
(2017-2021)
The distribution is based on data from 1,601 California zip codes.
U.S. Zip Codes
(2017-2021)
The distribution is based on data from 29,979 U.S. zip codes.
Marin, CA County Value
(0.2%)
The regional value is compared to the Marin County value.
Trend
This comparison measures the indicator’s values over multiple time periods.<br>The Mann-Kendall Test for Statistical Significance is used to evaluate the trend<br>over 4 to 10 periods of measure, subject to data availability and comparability.
Youth not in School or Working Zip Code: Stinson Beach (94970)
Youth not in School or Working Zip Code: Stinson Beach (94970)
0.0%
(2017-2021)
Compared to:
CA Zip Codes
The distribution is based on data from 1,601 California zip codes.
U.S. Zip Codes
The distribution is based on data from 29,979 U.S. zip codes.
Marin, CA County Value
(4.6%)
The regional value is compared to the Marin County value.
Trend
This comparison measures the indicator’s values over multiple time periods.<br>The Mann-Kendall Test for Statistical Significance is used to evaluate the trend<br>over 4 to 10 periods of measure, subject to data availability and comparability.
Youth not in School or Working Zip Code: Tomales (94971)
Youth not in School or Working Zip Code: Tomales (94971)
0.0%
(2018-2022)
Compared to:
CA Zip Codes
(2017-2021)
The distribution is based on data from 1,601 California zip codes.
U.S. Zip Codes
(2017-2021)
The distribution is based on data from 29,979 U.S. zip codes.
Marin, CA County Value
(0.2%)
The regional value is compared to the Marin County value.
Youth not in School or Working Zip Code: Woodacre (94973)
Youth not in School or Working Zip Code: Woodacre (94973)
0.0%
(2018-2022)
Compared to:
CA Zip Codes
(2017-2021)
The distribution is based on data from 1,601 California zip codes.
U.S. Zip Codes
(2017-2021)
The distribution is based on data from 29,979 U.S. zip codes.
Marin, CA County Value
(0.2%)
The regional value is compared to the Marin County value.
Trend
This comparison measures the indicator’s values over multiple time periods.<br>The Mann-Kendall Test for Statistical Significance is used to evaluate the trend<br>over 4 to 10 periods of measure, subject to data availability and comparability.
Youth not in School or Working Census Tract: 06041101100
Youth not in School or Working Census Tract: 06041101100
0.0%
(2018-2022)
Compared to:
U.S. Census Tracts
(2016-2020)
The distribution is based on data from 82,304 U.S. census tracts.
Marin, CA County Value
(0.2%)
The regional value is compared to the Marin County value.
Trend
This comparison measures the indicator’s values over multiple time periods.<br>The Mann-Kendall Test for Statistical Significance is used to evaluate the trend<br>over 4 to 10 periods of measure, subject to data availability and comparability.
Youth not in School or Working Census Tract: 06041101200
Youth not in School or Working Census Tract: 06041101200
0.0%
(2018-2022)
Compared to:
U.S. Census Tracts
(2016-2020)
The distribution is based on data from 82,304 U.S. census tracts.
Marin, CA County Value
(0.2%)
The regional value is compared to the Marin County value.
Trend
This comparison measures the indicator’s values over multiple time periods.<br>The Mann-Kendall Test for Statistical Significance is used to evaluate the trend<br>over 4 to 10 periods of measure, subject to data availability and comparability.
Youth not in School or Working Census Tract: 06041102100
Youth not in School or Working Census Tract: 06041102100
0.0%
(2018-2022)
Compared to:
U.S. Census Tracts
(2016-2020)
The distribution is based on data from 82,304 U.S. census tracts.
Marin, CA County Value
(0.2%)
The regional value is compared to the Marin County value.
Trend
This comparison measures the indicator’s values over multiple time periods.<br>The Mann-Kendall Test for Statistical Significance is used to evaluate the trend<br>over 4 to 10 periods of measure, subject to data availability and comparability.
Youth not in School or Working Census Tract: 06041102202
Youth not in School or Working Census Tract: 06041102202
0.0%
(2018-2022)
Compared to:
U.S. Census Tracts
(2016-2020)
The distribution is based on data from 82,304 U.S. census tracts.
Marin, CA County Value
(0.2%)
The regional value is compared to the Marin County value.
Trend
This comparison measures the indicator’s values over multiple time periods.<br>The Mann-Kendall Test for Statistical Significance is used to evaluate the trend<br>over 4 to 10 periods of measure, subject to data availability and comparability.
Youth not in School or Working Census Tract: 06041102203
Youth not in School or Working Census Tract: 06041102203
0.0%
(2018-2022)
Compared to:
U.S. Census Tracts
(2016-2020)
The distribution is based on data from 82,304 U.S. census tracts.
Marin, CA County Value
(0.2%)
The regional value is compared to the Marin County value.
Trend
This comparison measures the indicator’s values over multiple time periods.<br>The Mann-Kendall Test for Statistical Significance is used to evaluate the trend<br>over 4 to 10 periods of measure, subject to data availability and comparability.
Youth not in School or Working Census Tract: 06041103100
Youth not in School or Working Census Tract: 06041103100
0.0%
(2018-2022)
Compared to:
U.S. Census Tracts
(2016-2020)
The distribution is based on data from 82,304 U.S. census tracts.
Marin, CA County Value
(0.2%)
The regional value is compared to the Marin County value.
Trend
This comparison measures the indicator’s values over multiple time periods.<br>The Mann-Kendall Test for Statistical Significance is used to evaluate the trend<br>over 4 to 10 periods of measure, subject to data availability and comparability.
Youth not in School or Working Census Tract: 06041103200
Youth not in School or Working Census Tract: 06041103200
7.3%
(2018-2022)
Compared to:
U.S. Census Tracts
(2016-2020)
The distribution is based on data from 82,304 U.S. census tracts.
Marin, CA County Value
(0.2%)
The regional value is compared to the Marin County value.
Trend
This comparison measures the indicator’s values over multiple time periods.<br>The Mann-Kendall Test for Statistical Significance is used to evaluate the trend<br>over 4 to 10 periods of measure, subject to data availability and comparability.
Youth not in School or Working Census Tract: 06041104101
Youth not in School or Working Census Tract: 06041104101
0.0%
(2015-2019)
Compared to:
U.S. Census Tracts
The distribution is based on data from 71,866 U.S. census tracts.
Marin, CA County Value
(5.9%)
The regional value is compared to the Marin County value.
Youth not in School or Working Census Tract: 06041104102
Youth not in School or Working Census Tract: 06041104102
0.0%
(2018-2022)
Compared to:
U.S. Census Tracts
(2016-2020)
The distribution is based on data from 82,304 U.S. census tracts.
Marin, CA County Value
(0.2%)
The regional value is compared to the Marin County value.
Trend
This comparison measures the indicator’s values over multiple time periods.<br>The Mann-Kendall Test for Statistical Significance is used to evaluate the trend<br>over 4 to 10 periods of measure, subject to data availability and comparability.
Youth not in School or Working Census Tract: 06041104103
Youth not in School or Working Census Tract: 06041104103
0.0%
(2018-2022)
Compared to:
U.S. Census Tracts
(2016-2020)
The distribution is based on data from 82,304 U.S. census tracts.
Marin, CA County Value
(0.2%)
The regional value is compared to the Marin County value.
Youth not in School or Working Census Tract: 06041104104
Youth not in School or Working Census Tract: 06041104104
0.0%
(2018-2022)
Compared to:
U.S. Census Tracts
(2016-2020)
The distribution is based on data from 82,304 U.S. census tracts.
Marin, CA County Value
(0.2%)
The regional value is compared to the Marin County value.
Youth not in School or Working Census Tract: 06041104200
Youth not in School or Working Census Tract: 06041104200
0.0%
(2018-2022)
Compared to:
U.S. Census Tracts
(2016-2020)
The distribution is based on data from 82,304 U.S. census tracts.
Marin, CA County Value
(0.2%)
The regional value is compared to the Marin County value.
Trend
This comparison measures the indicator’s values over multiple time periods.<br>The Mann-Kendall Test for Statistical Significance is used to evaluate the trend<br>over 4 to 10 periods of measure, subject to data availability and comparability.
Youth not in School or Working Census Tract: 06041104300
Youth not in School or Working Census Tract: 06041104300
0.0%
(2018-2022)
Compared to:
U.S. Census Tracts
(2016-2020)
The distribution is based on data from 82,304 U.S. census tracts.
Marin, CA County Value
(0.2%)
The regional value is compared to the Marin County value.
Trend
This comparison measures the indicator’s values over multiple time periods.<br>The Mann-Kendall Test for Statistical Significance is used to evaluate the trend<br>over 4 to 10 periods of measure, subject to data availability and comparability.
Youth not in School or Working Census Tract: 06041105000
Youth not in School or Working Census Tract: 06041105000
25.0%
(2015-2019)
Compared to:
U.S. Census Tracts
The distribution is based on data from 71,866 U.S. census tracts.
Marin, CA County Value
(5.9%)
The regional value is compared to the Marin County value.
Youth not in School or Working Census Tract: 06041105001
Youth not in School or Working Census Tract: 06041105001
0.0%
(2018-2022)
Compared to:
U.S. Census Tracts
(2016-2020)
The distribution is based on data from 82,304 U.S. census tracts.
Marin, CA County Value
(0.2%)
The regional value is compared to the Marin County value.
Youth not in School or Working Census Tract: 06041105002
Youth not in School or Working Census Tract: 06041105002
0.0%
(2018-2022)
Compared to:
U.S. Census Tracts
(2016-2020)
The distribution is based on data from 82,304 U.S. census tracts.
Marin, CA County Value
(0.2%)
The regional value is compared to the Marin County value.
Youth not in School or Working Census Tract: 06041106001
Youth not in School or Working Census Tract: 06041106001
0.0%
(2018-2022)
Compared to:
U.S. Census Tracts
(2016-2020)
The distribution is based on data from 82,304 U.S. census tracts.
Marin, CA County Value
(0.2%)
The regional value is compared to the Marin County value.
Trend
This comparison measures the indicator’s values over multiple time periods.<br>The Mann-Kendall Test for Statistical Significance is used to evaluate the trend<br>over 4 to 10 periods of measure, subject to data availability and comparability.
Youth not in School or Working Census Tract: 06041106002
Youth not in School or Working Census Tract: 06041106002
0.0%
(2018-2022)
Compared to:
U.S. Census Tracts
(2016-2020)
The distribution is based on data from 82,304 U.S. census tracts.
Marin, CA County Value
(0.2%)
The regional value is compared to the Marin County value.
Trend
This comparison measures the indicator’s values over multiple time periods.<br>The Mann-Kendall Test for Statistical Significance is used to evaluate the trend<br>over 4 to 10 periods of measure, subject to data availability and comparability.
Youth not in School or Working Census Tract: 06041107000
Youth not in School or Working Census Tract: 06041107000
0.0%
(2018-2022)
Compared to:
U.S. Census Tracts
(2016-2020)
The distribution is based on data from 82,304 U.S. census tracts.
Marin, CA County Value
(0.2%)
The regional value is compared to the Marin County value.
Trend
This comparison measures the indicator’s values over multiple time periods.<br>The Mann-Kendall Test for Statistical Significance is used to evaluate the trend<br>over 4 to 10 periods of measure, subject to data availability and comparability.
Youth not in School or Working Census Tract: 06041108100
Youth not in School or Working Census Tract: 06041108100
0.0%
(2018-2022)
Compared to:
U.S. Census Tracts
(2016-2020)
The distribution is based on data from 82,304 U.S. census tracts.
Marin, CA County Value
(0.2%)
The regional value is compared to the Marin County value.
Trend
This comparison measures the indicator’s values over multiple time periods.<br>The Mann-Kendall Test for Statistical Significance is used to evaluate the trend<br>over 4 to 10 periods of measure, subject to data availability and comparability.
Youth not in School or Working Census Tract: 06041108200
Youth not in School or Working Census Tract: 06041108200
18.6%
(2015-2019)
Compared to:
U.S. Census Tracts
The distribution is based on data from 71,866 U.S. census tracts.
Marin, CA County Value
(5.9%)
The regional value is compared to the Marin County value.
Youth not in School or Working Census Tract: 06041108201
Youth not in School or Working Census Tract: 06041108201
0.0%
(2018-2022)
Compared to:
U.S. Census Tracts
(2016-2020)
The distribution is based on data from 82,304 U.S. census tracts.
Marin, CA County Value
(0.2%)
The regional value is compared to the Marin County value.
Youth not in School or Working Census Tract: 06041108202
Youth not in School or Working Census Tract: 06041108202
0.0%
(2018-2022)
Compared to:
U.S. Census Tracts
(2016-2020)
The distribution is based on data from 82,304 U.S. census tracts.
Marin, CA County Value
(0.2%)
The regional value is compared to the Marin County value.
Youth not in School or Working Census Tract: 06041109001
Youth not in School or Working Census Tract: 06041109001
0.0%
(2018-2022)
Compared to:
U.S. Census Tracts
(2016-2020)
The distribution is based on data from 82,304 U.S. census tracts.
Marin, CA County Value
(0.2%)
The regional value is compared to the Marin County value.
Trend
This comparison measures the indicator’s values over multiple time periods.<br>The Mann-Kendall Test for Statistical Significance is used to evaluate the trend<br>over 4 to 10 periods of measure, subject to data availability and comparability.
Youth not in School or Working Census Tract: 06041109002
Youth not in School or Working Census Tract: 06041109002
0.0%
(2018-2022)
Compared to:
U.S. Census Tracts
(2016-2020)
The distribution is based on data from 82,304 U.S. census tracts.
Marin, CA County Value
(0.2%)
The regional value is compared to the Marin County value.
Trend
This comparison measures the indicator’s values over multiple time periods.<br>The Mann-Kendall Test for Statistical Significance is used to evaluate the trend<br>over 4 to 10 periods of measure, subject to data availability and comparability.
Youth not in School or Working Census Tract: 06041110100
Youth not in School or Working Census Tract: 06041110100
0.0%
(2018-2022)
Compared to:
U.S. Census Tracts
(2016-2020)
The distribution is based on data from 82,304 U.S. census tracts.
Marin, CA County Value
(0.2%)
The regional value is compared to the Marin County value.
Trend
This comparison measures the indicator’s values over multiple time periods.<br>The Mann-Kendall Test for Statistical Significance is used to evaluate the trend<br>over 4 to 10 periods of measure, subject to data availability and comparability.
Youth not in School or Working Census Tract: 06041110200
Youth not in School or Working Census Tract: 06041110200
0.0%
(2018-2022)
Compared to:
U.S. Census Tracts
(2016-2020)
The distribution is based on data from 82,304 U.S. census tracts.
Marin, CA County Value
(0.2%)
The regional value is compared to the Marin County value.
Trend
This comparison measures the indicator’s values over multiple time periods.<br>The Mann-Kendall Test for Statistical Significance is used to evaluate the trend<br>over 4 to 10 periods of measure, subject to data availability and comparability.
Youth not in School or Working Census Tract: 06041111000
Youth not in School or Working Census Tract: 06041111000
0.0%
(2015-2019)
Compared to:
U.S. Census Tracts
The distribution is based on data from 71,866 U.S. census tracts.
Marin, CA County Value
(5.9%)
The regional value is compared to the Marin County value.
Youth not in School or Working Census Tract: 06041111002
Youth not in School or Working Census Tract: 06041111002
0.0%
(2018-2022)
Compared to:
U.S. Census Tracts
(2016-2020)
The distribution is based on data from 82,304 U.S. census tracts.
Marin, CA County Value
(0.2%)
The regional value is compared to the Marin County value.
Youth not in School or Working Census Tract: 06041112100
Youth not in School or Working Census Tract: 06041112100
0.0%
(2018-2022)
Compared to:
U.S. Census Tracts
(2016-2020)
The distribution is based on data from 82,304 U.S. census tracts.
Marin, CA County Value
(0.2%)
The regional value is compared to the Marin County value.
Trend
This comparison measures the indicator’s values over multiple time periods.<br>The Mann-Kendall Test for Statistical Significance is used to evaluate the trend<br>over 4 to 10 periods of measure, subject to data availability and comparability.
Youth not in School or Working Census Tract: 06041112201
Youth not in School or Working Census Tract: 06041112201
17.5%
(2015-2019)
Compared to:
U.S. Census Tracts
The distribution is based on data from 71,866 U.S. census tracts.
Marin, CA County Value
(5.9%)
The regional value is compared to the Marin County value.
Youth not in School or Working Census Tract: 06041112202
Youth not in School or Working Census Tract: 06041112202
0.0%
(2018-2022)
Compared to:
U.S. Census Tracts
(2016-2020)
The distribution is based on data from 82,304 U.S. census tracts.
Marin, CA County Value
(0.2%)
The regional value is compared to the Marin County value.
Trend
This comparison measures the indicator’s values over multiple time periods.<br>The Mann-Kendall Test for Statistical Significance is used to evaluate the trend<br>over 4 to 10 periods of measure, subject to data availability and comparability.
Youth not in School or Working Census Tract: 06041112203
Youth not in School or Working Census Tract: 06041112203
0.0%
(2018-2022)
Compared to:
U.S. Census Tracts
(2016-2020)
The distribution is based on data from 82,304 U.S. census tracts.
Marin, CA County Value
(0.2%)
The regional value is compared to the Marin County value.
Youth not in School or Working Census Tract: 06041112204
Youth not in School or Working Census Tract: 06041112204
0.0%
(2018-2022)
Compared to:
U.S. Census Tracts
(2016-2020)
The distribution is based on data from 82,304 U.S. census tracts.
Marin, CA County Value
(0.2%)
The regional value is compared to the Marin County value.
Youth not in School or Working Census Tract: 06041113000
Youth not in School or Working Census Tract: 06041113000
0.0%
(2018-2022)
Compared to:
U.S. Census Tracts
(2016-2020)
The distribution is based on data from 82,304 U.S. census tracts.
Marin, CA County Value
(0.2%)
The regional value is compared to the Marin County value.
Trend
This comparison measures the indicator’s values over multiple time periods.<br>The Mann-Kendall Test for Statistical Significance is used to evaluate the trend<br>over 4 to 10 periods of measure, subject to data availability and comparability.
Youth not in School or Working Census Tract: 06041114100
Youth not in School or Working Census Tract: 06041114100
0.0%
(2018-2022)
Compared to:
U.S. Census Tracts
(2016-2020)
The distribution is based on data from 82,304 U.S. census tracts.
Marin, CA County Value
(0.2%)
The regional value is compared to the Marin County value.
Trend
This comparison measures the indicator’s values over multiple time periods.<br>The Mann-Kendall Test for Statistical Significance is used to evaluate the trend<br>over 4 to 10 periods of measure, subject to data availability and comparability.
Youth not in School or Working Census Tract: 06041114200
Youth not in School or Working Census Tract: 06041114200
0.0%
(2018-2022)
Compared to:
U.S. Census Tracts
(2016-2020)
The distribution is based on data from 82,304 U.S. census tracts.
Marin, CA County Value
(0.2%)
The regional value is compared to the Marin County value.
Trend
This comparison measures the indicator’s values over multiple time periods.<br>The Mann-Kendall Test for Statistical Significance is used to evaluate the trend<br>over 4 to 10 periods of measure, subject to data availability and comparability.
Youth not in School or Working Census Tract: 06041115000
Youth not in School or Working Census Tract: 06041115000
0.0%
(2018-2022)
Compared to:
U.S. Census Tracts
(2016-2020)
The distribution is based on data from 82,304 U.S. census tracts.
Marin, CA County Value
(0.2%)
The regional value is compared to the Marin County value.
Trend
This comparison measures the indicator’s values over multiple time periods.<br>The Mann-Kendall Test for Statistical Significance is used to evaluate the trend<br>over 4 to 10 periods of measure, subject to data availability and comparability.
Youth not in School or Working Census Tract: 06041116000
Youth not in School or Working Census Tract: 06041116000
0.0%
(2018-2022)
Compared to:
U.S. Census Tracts
(2016-2020)
The distribution is based on data from 82,304 U.S. census tracts.
Marin, CA County Value
(0.2%)
The regional value is compared to the Marin County value.
Trend
This comparison measures the indicator’s values over multiple time periods.<br>The Mann-Kendall Test for Statistical Significance is used to evaluate the trend<br>over 4 to 10 periods of measure, subject to data availability and comparability.
Youth not in School or Working Census Tract: 06041117000
Youth not in School or Working Census Tract: 06041117000
0.0%
(2018-2022)
Compared to:
U.S. Census Tracts
(2016-2020)
The distribution is based on data from 82,304 U.S. census tracts.
Marin, CA County Value
(0.2%)
The regional value is compared to the Marin County value.
Trend
This comparison measures the indicator’s values over multiple time periods.<br>The Mann-Kendall Test for Statistical Significance is used to evaluate the trend<br>over 4 to 10 periods of measure, subject to data availability and comparability.
Youth not in School or Working Census Tract: 06041118100
Youth not in School or Working Census Tract: 06041118100
0.0%
(2018-2022)
Compared to:
U.S. Census Tracts
(2016-2020)
The distribution is based on data from 82,304 U.S. census tracts.
Marin, CA County Value
(0.2%)
The regional value is compared to the Marin County value.
Trend
This comparison measures the indicator’s values over multiple time periods.<br>The Mann-Kendall Test for Statistical Significance is used to evaluate the trend<br>over 4 to 10 periods of measure, subject to data availability and comparability.
Youth not in School or Working Census Tract: 06041119100
Youth not in School or Working Census Tract: 06041119100
0.0%
(2018-2022)
Compared to:
U.S. Census Tracts
(2016-2020)
The distribution is based on data from 82,304 U.S. census tracts.
Marin, CA County Value
(0.2%)
The regional value is compared to the Marin County value.
Trend
This comparison measures the indicator’s values over multiple time periods.<br>The Mann-Kendall Test for Statistical Significance is used to evaluate the trend<br>over 4 to 10 periods of measure, subject to data availability and comparability.
Youth not in School or Working Census Tract: 06041119201
Youth not in School or Working Census Tract: 06041119201
0.0%
(2018-2022)
Compared to:
U.S. Census Tracts
(2016-2020)
The distribution is based on data from 82,304 U.S. census tracts.
Marin, CA County Value
(0.2%)
The regional value is compared to the Marin County value.
Trend
This comparison measures the indicator’s values over multiple time periods.<br>The Mann-Kendall Test for Statistical Significance is used to evaluate the trend<br>over 4 to 10 periods of measure, subject to data availability and comparability.
Youth not in School or Working Census Tract: 06041119202
Youth not in School or Working Census Tract: 06041119202
0.0%
(2018-2022)
Compared to:
U.S. Census Tracts
(2016-2020)
The distribution is based on data from 82,304 U.S. census tracts.
Marin, CA County Value
(0.2%)
The regional value is compared to the Marin County value.
Trend
This comparison measures the indicator’s values over multiple time periods.<br>The Mann-Kendall Test for Statistical Significance is used to evaluate the trend<br>over 4 to 10 periods of measure, subject to data availability and comparability.
Youth not in School or Working Census Tract: 06041120000
Youth not in School or Working Census Tract: 06041120000
27.6%
(2015-2019)
Compared to:
U.S. Census Tracts
The distribution is based on data from 71,866 U.S. census tracts.
Marin, CA County Value
(5.9%)
The regional value is compared to the Marin County value.
Youth not in School or Working Census Tract: 06041120001
Youth not in School or Working Census Tract: 06041120001
0.0%
(2018-2022)
Compared to:
U.S. Census Tracts
(2016-2020)
The distribution is based on data from 82,304 U.S. census tracts.
Marin, CA County Value
(0.2%)
The regional value is compared to the Marin County value.
Youth not in School or Working Census Tract: 06041120002
Youth not in School or Working Census Tract: 06041120002
0.0%
(2018-2022)
Compared to:
U.S. Census Tracts
(2016-2020)
The distribution is based on data from 82,304 U.S. census tracts.
Marin, CA County Value
(0.2%)
The regional value is compared to the Marin County value.
Youth not in School or Working Census Tract: 06041121100
Youth not in School or Working Census Tract: 06041121100
0.0%
(2018-2022)
Compared to:
U.S. Census Tracts
(2016-2020)
The distribution is based on data from 82,304 U.S. census tracts.
Marin, CA County Value
(0.2%)
The regional value is compared to the Marin County value.
Trend
This comparison measures the indicator’s values over multiple time periods.<br>The Mann-Kendall Test for Statistical Significance is used to evaluate the trend<br>over 4 to 10 periods of measure, subject to data availability and comparability.
Youth not in School or Working Census Tract: 06041121200
Youth not in School or Working Census Tract: 06041121200
0.0%
(2018-2022)
Compared to:
U.S. Census Tracts
(2016-2020)
The distribution is based on data from 82,304 U.S. census tracts.
Marin, CA County Value
(0.2%)
The regional value is compared to the Marin County value.
Trend
This comparison measures the indicator’s values over multiple time periods.<br>The Mann-Kendall Test for Statistical Significance is used to evaluate the trend<br>over 4 to 10 periods of measure, subject to data availability and comparability.
Youth not in School or Working Census Tract: 06041122000
Youth not in School or Working Census Tract: 06041122000
80.6%
(2015-2019)
Compared to:
U.S. Census Tracts
The distribution is based on data from 71,866 U.S. census tracts.
Marin, CA County Value
(5.9%)
The regional value is compared to the Marin County value.
Youth not in School or Working Census Tract: 06041123000
Youth not in School or Working Census Tract: 06041123000
0.0%
(2018-2022)
Compared to:
U.S. Census Tracts
(2016-2020)
The distribution is based on data from 82,304 U.S. census tracts.
Marin, CA County Value
(0.2%)
The regional value is compared to the Marin County value.
Trend
This comparison measures the indicator’s values over multiple time periods.<br>The Mann-Kendall Test for Statistical Significance is used to evaluate the trend<br>over 4 to 10 periods of measure, subject to data availability and comparability.
Youth not in School or Working Census Tract: 06041124100
Youth not in School or Working Census Tract: 06041124100
0.0%
(2018-2022)
Compared to:
U.S. Census Tracts
(2016-2020)
The distribution is based on data from 82,304 U.S. census tracts.
Marin, CA County Value
(0.2%)
The regional value is compared to the Marin County value.
Trend
This comparison measures the indicator’s values over multiple time periods.<br>The Mann-Kendall Test for Statistical Significance is used to evaluate the trend<br>over 4 to 10 periods of measure, subject to data availability and comparability.
Youth not in School or Working Census Tract: 06041124200
Youth not in School or Working Census Tract: 06041124200
0.0%
(2018-2022)
Compared to:
U.S. Census Tracts
(2016-2020)
The distribution is based on data from 82,304 U.S. census tracts.
Marin, CA County Value
(0.2%)
The regional value is compared to the Marin County value.
Trend
This comparison measures the indicator’s values over multiple time periods.<br>The Mann-Kendall Test for Statistical Significance is used to evaluate the trend<br>over 4 to 10 periods of measure, subject to data availability and comparability.
Youth not in School or Working Census Tract: 06041125000
Youth not in School or Working Census Tract: 06041125000
0.0%
(2018-2022)
Compared to:
U.S. Census Tracts
(2016-2020)
The distribution is based on data from 82,304 U.S. census tracts.
Marin, CA County Value
(0.2%)
The regional value is compared to the Marin County value.
Trend
This comparison measures the indicator’s values over multiple time periods.<br>The Mann-Kendall Test for Statistical Significance is used to evaluate the trend<br>over 4 to 10 periods of measure, subject to data availability and comparability.
Youth not in School or Working Census Tract: 06041126100
Youth not in School or Working Census Tract: 06041126100
0.0%
(2018-2022)
Compared to:
U.S. Census Tracts
(2016-2020)
The distribution is based on data from 82,304 U.S. census tracts.
Marin, CA County Value
(0.2%)
The regional value is compared to the Marin County value.
Trend
This comparison measures the indicator’s values over multiple time periods.<br>The Mann-Kendall Test for Statistical Significance is used to evaluate the trend<br>over 4 to 10 periods of measure, subject to data availability and comparability.
Youth not in School or Working Census Tract: 06041126200
Youth not in School or Working Census Tract: 06041126200
0.0%
(2018-2022)
Compared to:
U.S. Census Tracts
(2016-2020)
The distribution is based on data from 82,304 U.S. census tracts.
Marin, CA County Value
(0.2%)
The regional value is compared to the Marin County value.
Trend
This comparison measures the indicator’s values over multiple time periods.<br>The Mann-Kendall Test for Statistical Significance is used to evaluate the trend<br>over 4 to 10 periods of measure, subject to data availability and comparability.
Youth not in School or Working Census Tract: 06041127000
Youth not in School or Working Census Tract: 06041127000
0.0%
(2018-2022)
Compared to:
U.S. Census Tracts
(2016-2020)
The distribution is based on data from 82,304 U.S. census tracts.
Marin, CA County Value
(0.2%)
The regional value is compared to the Marin County value.
Trend
This comparison measures the indicator’s values over multiple time periods.<br>The Mann-Kendall Test for Statistical Significance is used to evaluate the trend<br>over 4 to 10 periods of measure, subject to data availability and comparability.
Youth not in School or Working Census Tract: 06041128100
Youth not in School or Working Census Tract: 06041128100
0.0%
(2018-2022)
Compared to:
U.S. Census Tracts
(2016-2020)
The distribution is based on data from 82,304 U.S. census tracts.
Marin, CA County Value
(0.2%)
The regional value is compared to the Marin County value.
Trend
This comparison measures the indicator’s values over multiple time periods.<br>The Mann-Kendall Test for Statistical Significance is used to evaluate the trend<br>over 4 to 10 periods of measure, subject to data availability and comparability.
Youth not in School or Working Census Tract: 06041128200
Youth not in School or Working Census Tract: 06041128200
0.0%
(2018-2022)
Compared to:
U.S. Census Tracts
(2016-2020)
The distribution is based on data from 82,304 U.S. census tracts.
Marin, CA County Value
(0.2%)
The regional value is compared to the Marin County value.
Trend
This comparison measures the indicator’s values over multiple time periods.<br>The Mann-Kendall Test for Statistical Significance is used to evaluate the trend<br>over 4 to 10 periods of measure, subject to data availability and comparability.
Youth not in School or Working Census Tract: 06041129000
Youth not in School or Working Census Tract: 06041129000
0.0%
(2018-2022)
Compared to:
U.S. Census Tracts
(2016-2020)
The distribution is based on data from 82,304 U.S. census tracts.
Marin, CA County Value
(0.2%)
The regional value is compared to the Marin County value.
Trend
This comparison measures the indicator’s values over multiple time periods.<br>The Mann-Kendall Test for Statistical Significance is used to evaluate the trend<br>over 4 to 10 periods of measure, subject to data availability and comparability.
Youth not in School or Working Census Tract: 06041130201
Youth not in School or Working Census Tract: 06041130201
0.0%
(2018-2022)
Compared to:
U.S. Census Tracts
(2016-2020)
The distribution is based on data from 82,304 U.S. census tracts.
Marin, CA County Value
(0.2%)
The regional value is compared to the Marin County value.
Trend
This comparison measures the indicator’s values over multiple time periods.<br>The Mann-Kendall Test for Statistical Significance is used to evaluate the trend<br>over 4 to 10 periods of measure, subject to data availability and comparability.
Youth not in School or Working Census Tract: 06041130203
Youth not in School or Working Census Tract: 06041130203
0.0%
(2018-2022)
Compared to:
U.S. Census Tracts
(2016-2020)
The distribution is based on data from 82,304 U.S. census tracts.
Marin, CA County Value
(0.2%)
The regional value is compared to the Marin County value.
Youth not in School or Working Census Tract: 06041130204
Youth not in School or Working Census Tract: 06041130204
0.0%
(2018-2022)
Compared to:
U.S. Census Tracts
(2016-2020)
The distribution is based on data from 82,304 U.S. census tracts.
Marin, CA County Value
(0.2%)
The regional value is compared to the Marin County value.
Youth not in School or Working Census Tract: 06041131100
Youth not in School or Working Census Tract: 06041131100
0.0%
(2018-2022)
Compared to:
U.S. Census Tracts
(2016-2020)
The distribution is based on data from 82,304 U.S. census tracts.
Marin, CA County Value
(0.2%)
The regional value is compared to the Marin County value.
Trend
This comparison measures the indicator’s values over multiple time periods.<br>The Mann-Kendall Test for Statistical Significance is used to evaluate the trend<br>over 4 to 10 periods of measure, subject to data availability and comparability.
Youth not in School or Working Census Tract: 06041132100
Youth not in School or Working Census Tract: 06041132100
0.0%
(2017-2021)
Compared to:
U.S. Census Tracts
(2016-2020)
The distribution is based on data from 82,304 U.S. census tracts.
Marin, CA County Value
(4.6%)
The regional value is compared to the Marin County value.
Trend
This comparison measures the indicator’s values over multiple time periods.<br>The Mann-Kendall Test for Statistical Significance is used to evaluate the trend<br>over 4 to 10 periods of measure, subject to data availability and comparability.
Youth not in School or Working Census Tract: 06041132200
Youth not in School or Working Census Tract: 06041132200
0.0%
(2018-2022)
Compared to:
U.S. Census Tracts
(2016-2020)
The distribution is based on data from 82,304 U.S. census tracts.
Marin, CA County Value
(0.2%)
The regional value is compared to the Marin County value.
Trend
This comparison measures the indicator’s values over multiple time periods.<br>The Mann-Kendall Test for Statistical Significance is used to evaluate the trend<br>over 4 to 10 periods of measure, subject to data availability and comparability.
Youth not in School or Working Census Tract: 06041133000
Youth not in School or Working Census Tract: 06041133000
1.5%
(2018-2022)
Compared to:
U.S. Census Tracts
(2016-2020)
The distribution is based on data from 82,304 U.S. census tracts.
Marin, CA County Value
(0.2%)
The regional value is compared to the Marin County value.
Trend
This comparison measures the indicator’s values over multiple time periods.<br>The Mann-Kendall Test for Statistical Significance is used to evaluate the trend<br>over 4 to 10 periods of measure, subject to data availability and comparability.
Education / Childcare & Early Childhood Education
Child Care Centers County: Marin
Child Care Centers County: Marin
14.4
Per 1,000 population under age 5
(2022)
Compared to:
CA Counties
The distribution is based on data from 58 California counties.
CA Value
(8.1)
The regional value is compared to the California state value.
US Value
(7.0)
The regional value is compared to the national value.
Prior Value
(13.1)
Prior Value compares a measured value with the previously measured value. Confidence intervals were not taken into account in determining the direction of the comparison.
Education / Educational Attainment
People 25+ with a Bachelor's Degree or Higher County: Marin
People 25+ with a Bachelor's Degree or Higher County: Marin
61.1%
(2018-2022)
Compared to:
CA Counties
The distribution is based on data from 58 California counties.
U.S. Counties
The distribution is based on data from 3,133 U.S. counties and county equivalents.
CA Value
(35.9%)
The regional value is compared to the California state value.
US Value
(34.3%)
The regional value is compared to the national value.
Trend
This comparison measures the indicator’s values over multiple time periods.<br>The Mann-Kendall Test for Statistical Significance is used to evaluate the trend<br>over 4 to 10 periods of measure, subject to data availability and comparability.
People 25+ with a Bachelor's Degree or Higher Census Place: Alto
People 25+ with a Bachelor's Degree or Higher Census Place: Alto
55.5%
(2018-2022)
Compared to:

CA Census Places
The distribution is based on data from 1,482 locales.
U.S. Census Places
The distribution is based on data from 28,880 U.S. Census Places.
Marin, CA County Value
(61.1%)
The regional value is compared to the Marin County value.
CA Value
(35.9%)
The regional value is compared to the California state value.
US Value
(34.3%)
The regional value is compared to the national value.
Trend
This comparison measures the indicator’s values over multiple time periods.<br>The Mann-Kendall Test for Statistical Significance is used to evaluate the trend<br>over 4 to 10 periods of measure, subject to data availability and comparability.
People 25+ with a Bachelor's Degree or Higher Census Place: Belvedere
People 25+ with a Bachelor's Degree or Higher Census Place: Belvedere
83.9%
(2018-2022)
Compared to:
CA Census Places
The distribution is based on data from 1,482 locales.
U.S. Census Places
The distribution is based on data from 28,880 U.S. Census Places.
Marin, CA County Value
(61.1%)
The regional value is compared to the Marin County value.
CA Value
(35.9%)
The regional value is compared to the California state value.
US Value
(34.3%)
The regional value is compared to the national value.
Trend
This comparison measures the indicator’s values over multiple time periods.<br>The Mann-Kendall Test for Statistical Significance is used to evaluate the trend<br>over 4 to 10 periods of measure, subject to data availability and comparability.
People 25+ with a Bachelor's Degree or Higher Census Place: Black Point-Green Point
People 25+ with a Bachelor's Degree or Higher Census Place: Black Point-Green Point
58.4%
(2018-2022)
Compared to:

CA Census Places
The distribution is based on data from 1,482 locales.
U.S. Census Places
The distribution is based on data from 28,880 U.S. Census Places.
Marin, CA County Value
(61.1%)
The regional value is compared to the Marin County value.
CA Value
(35.9%)
The regional value is compared to the California state value.
US Value
(34.3%)
The regional value is compared to the national value.
Trend
This comparison measures the indicator’s values over multiple time periods.<br>The Mann-Kendall Test for Statistical Significance is used to evaluate the trend<br>over 4 to 10 periods of measure, subject to data availability and comparability.
People 25+ with a Bachelor's Degree or Higher Census Place: Bolinas
People 25+ with a Bachelor's Degree or Higher Census Place: Bolinas
52.1%
(2018-2022)
Compared to:
CA Census Places
The distribution is based on data from 1,482 locales.
U.S. Census Places
The distribution is based on data from 28,880 U.S. Census Places.
Marin, CA County Value
(61.1%)
The regional value is compared to the Marin County value.
CA Value
(35.9%)
The regional value is compared to the California state value.
US Value
(34.3%)
The regional value is compared to the national value.
Trend
This comparison measures the indicator’s values over multiple time periods.<br>The Mann-Kendall Test for Statistical Significance is used to evaluate the trend<br>over 4 to 10 periods of measure, subject to data availability and comparability.
People 25+ with a Bachelor's Degree or Higher Census Place: Corte Madera
People 25+ with a Bachelor's Degree or Higher Census Place: Corte Madera
76.3%
(2018-2022)
Compared to:
CA Census Places
The distribution is based on data from 1,482 locales.
U.S. Census Places
The distribution is based on data from 28,880 U.S. Census Places.
Marin, CA County Value
(61.1%)
The regional value is compared to the Marin County value.
CA Value
(35.9%)
The regional value is compared to the California state value.
US Value
(34.3%)
The regional value is compared to the national value.
Trend
This comparison measures the indicator’s values over multiple time periods.<br>The Mann-Kendall Test for Statistical Significance is used to evaluate the trend<br>over 4 to 10 periods of measure, subject to data availability and comparability.
People 25+ with a Bachelor's Degree or Higher Census Place: Dillon Beach
People 25+ with a Bachelor's Degree or Higher Census Place: Dillon Beach
82.2%
(2018-2022)
Compared to:
CA Census Places
The distribution is based on data from 1,482 locales.
U.S. Census Places
The distribution is based on data from 28,880 U.S. Census Places.
Marin, CA County Value
(61.1%)
The regional value is compared to the Marin County value.
CA Value
(35.9%)
The regional value is compared to the California state value.
US Value
(34.3%)
The regional value is compared to the national value.
Trend
This comparison measures the indicator’s values over multiple time periods.<br>The Mann-Kendall Test for Statistical Significance is used to evaluate the trend<br>over 4 to 10 periods of measure, subject to data availability and comparability.
People 25+ with a Bachelor's Degree or Higher Census Place: Fairfax
People 25+ with a Bachelor's Degree or Higher Census Place: Fairfax
68.0%
(2018-2022)
Compared to:
CA Census Places
The distribution is based on data from 1,482 locales.
U.S. Census Places
The distribution is based on data from 28,880 U.S. Census Places.
Marin, CA County Value
(61.1%)
The regional value is compared to the Marin County value.
CA Value
(35.9%)
The regional value is compared to the California state value.
US Value
(34.3%)
The regional value is compared to the national value.
Trend
This comparison measures the indicator’s values over multiple time periods.<br>The Mann-Kendall Test for Statistical Significance is used to evaluate the trend<br>over 4 to 10 periods of measure, subject to data availability and comparability.
People 25+ with a Bachelor's Degree or Higher Census Place: Inverness
People 25+ with a Bachelor's Degree or Higher Census Place: Inverness
66.5%
(2018-2022)
Compared to:
CA Census Places
The distribution is based on data from 1,482 locales.
U.S. Census Places
The distribution is based on data from 28,880 U.S. Census Places.
Marin, CA County Value
(61.1%)
The regional value is compared to the Marin County value.
CA Value
(35.9%)
The regional value is compared to the California state value.
US Value
(34.3%)
The regional value is compared to the national value.
Trend
This comparison measures the indicator’s values over multiple time periods.<br>The Mann-Kendall Test for Statistical Significance is used to evaluate the trend<br>over 4 to 10 periods of measure, subject to data availability and comparability.
People 25+ with a Bachelor's Degree or Higher Census Place: Kentfield
People 25+ with a Bachelor's Degree or Higher Census Place: Kentfield
76.0%
(2018-2022)
Compared to:

CA Census Places
The distribution is based on data from 1,482 locales.
U.S. Census Places
The distribution is based on data from 28,880 U.S. Census Places.
Marin, CA County Value
(61.1%)
The regional value is compared to the Marin County value.
CA Value
(35.9%)
The regional value is compared to the California state value.
US Value
(34.3%)
The regional value is compared to the national value.
Trend
This comparison measures the indicator’s values over multiple time periods.<br>The Mann-Kendall Test for Statistical Significance is used to evaluate the trend<br>over 4 to 10 periods of measure, subject to data availability and comparability.
People 25+ with a Bachelor's Degree or Higher Census Place: Lagunitas-Forest Knolls
People 25+ with a Bachelor's Degree or Higher Census Place: Lagunitas-Forest Knolls
50.5%
(2018-2022)
Compared to:
CA Census Places
The distribution is based on data from 1,482 locales.
U.S. Census Places
The distribution is based on data from 28,880 U.S. Census Places.
Marin, CA County Value
(61.1%)
The regional value is compared to the Marin County value.
CA Value
(35.9%)
The regional value is compared to the California state value.
US Value
(34.3%)
The regional value is compared to the national value.
Trend
This comparison measures the indicator’s values over multiple time periods.<br>The Mann-Kendall Test for Statistical Significance is used to evaluate the trend<br>over 4 to 10 periods of measure, subject to data availability and comparability.
People 25+ with a Bachelor's Degree or Higher Census Place: Larkspur
People 25+ with a Bachelor's Degree or Higher Census Place: Larkspur
71.5%
(2018-2022)
Compared to:
CA Census Places
The distribution is based on data from 1,482 locales.
U.S. Census Places
The distribution is based on data from 28,880 U.S. Census Places.
Marin, CA County Value
(61.1%)
The regional value is compared to the Marin County value.
CA Value
(35.9%)
The regional value is compared to the California state value.
US Value
(34.3%)
The regional value is compared to the national value.
Trend
This comparison measures the indicator’s values over multiple time periods.<br>The Mann-Kendall Test for Statistical Significance is used to evaluate the trend<br>over 4 to 10 periods of measure, subject to data availability and comparability.
People 25+ with a Bachelor's Degree or Higher Census Place: Lucas Valley-Marinwood
People 25+ with a Bachelor's Degree or Higher Census Place: Lucas Valley-Marinwood
74.9%
(2018-2022)
Compared to:
CA Census Places
The distribution is based on data from 1,482 locales.
U.S. Census Places
The distribution is based on data from 28,880 U.S. Census Places.
Marin, CA County Value
(61.1%)
The regional value is compared to the Marin County value.
CA Value
(35.9%)
The regional value is compared to the California state value.
US Value
(34.3%)
The regional value is compared to the national value.
Trend
This comparison measures the indicator’s values over multiple time periods.<br>The Mann-Kendall Test for Statistical Significance is used to evaluate the trend<br>over 4 to 10 periods of measure, subject to data availability and comparability.
People 25+ with a Bachelor's Degree or Higher Census Place: Marin City
People 25+ with a Bachelor's Degree or Higher Census Place: Marin City
49.2%
(2018-2022)
Compared to:
CA Census Places
The distribution is based on data from 1,482 locales.
U.S. Census Places
The distribution is based on data from 28,880 U.S. Census Places.
Marin, CA County Value
(61.1%)
The regional value is compared to the Marin County value.
CA Value
(35.9%)
The regional value is compared to the California state value.
US Value
(34.3%)
The regional value is compared to the national value.
Trend
This comparison measures the indicator’s values over multiple time periods.<br>The Mann-Kendall Test for Statistical Significance is used to evaluate the trend<br>over 4 to 10 periods of measure, subject to data availability and comparability.
People 25+ with a Bachelor's Degree or Higher Census Place: Mill Valley
People 25+ with a Bachelor's Degree or Higher Census Place: Mill Valley
75.9%
(2018-2022)
Compared to:
CA Census Places
The distribution is based on data from 1,482 locales.
U.S. Census Places
The distribution is based on data from 28,880 U.S. Census Places.
Marin, CA County Value
(61.1%)
The regional value is compared to the Marin County value.
CA Value
(35.9%)
The regional value is compared to the California state value.
US Value
(34.3%)
The regional value is compared to the national value.
Trend
This comparison measures the indicator’s values over multiple time periods.<br>The Mann-Kendall Test for Statistical Significance is used to evaluate the trend<br>over 4 to 10 periods of measure, subject to data availability and comparability.
People 25+ with a Bachelor's Degree or Higher Census Place: Muir Beach
People 25+ with a Bachelor's Degree or Higher Census Place: Muir Beach
78.6%
(2018-2022)
Compared to:
CA Census Places
The distribution is based on data from 1,482 locales.
U.S. Census Places
The distribution is based on data from 28,880 U.S. Census Places.
Marin, CA County Value
(61.1%)
The regional value is compared to the Marin County value.
CA Value
(35.9%)
The regional value is compared to the California state value.
US Value
(34.3%)
The regional value is compared to the national value.
Trend
This comparison measures the indicator’s values over multiple time periods.<br>The Mann-Kendall Test for Statistical Significance is used to evaluate the trend<br>over 4 to 10 periods of measure, subject to data availability and comparability.
People 25+ with a Bachelor's Degree or Higher Census Place: Nicasio
People 25+ with a Bachelor's Degree or Higher Census Place: Nicasio
83.9%
(2018-2022)
Compared to:
CA Census Places
The distribution is based on data from 1,482 locales.
U.S. Census Places
The distribution is based on data from 28,880 U.S. Census Places.
Marin, CA County Value
(61.1%)
The regional value is compared to the Marin County value.
CA Value
(35.9%)
The regional value is compared to the California state value.
US Value
(34.3%)
The regional value is compared to the national value.
Trend
This comparison measures the indicator’s values over multiple time periods.<br>The Mann-Kendall Test for Statistical Significance is used to evaluate the trend<br>over 4 to 10 periods of measure, subject to data availability and comparability.
People 25+ with a Bachelor's Degree or Higher Census Place: Novato
People 25+ with a Bachelor's Degree or Higher Census Place: Novato
48.4%
(2018-2022)
Compared to:
CA Census Places
The distribution is based on data from 1,482 locales.
U.S. Census Places
The distribution is based on data from 28,880 U.S. Census Places.
Marin, CA County Value
(61.1%)
The regional value is compared to the Marin County value.
CA Value
(35.9%)
The regional value is compared to the California state value.
US Value
(34.3%)
The regional value is compared to the national value.
Trend
This comparison measures the indicator’s values over multiple time periods.<br>The Mann-Kendall Test for Statistical Significance is used to evaluate the trend<br>over 4 to 10 periods of measure, subject to data availability and comparability.
People 25+ with a Bachelor's Degree or Higher Census Place: Point Reyes Station
People 25+ with a Bachelor's Degree or Higher Census Place: Point Reyes Station
56.7%
(2018-2022)
Compared to:
CA Census Places
The distribution is based on data from 1,482 locales.
U.S. Census Places
The distribution is based on data from 28,880 U.S. Census Places.
Marin, CA County Value
(61.1%)
The regional value is compared to the Marin County value.
CA Value
(35.9%)
The regional value is compared to the California state value.
US Value
(34.3%)
The regional value is compared to the national value.
Trend
This comparison measures the indicator’s values over multiple time periods.<br>The Mann-Kendall Test for Statistical Significance is used to evaluate the trend<br>over 4 to 10 periods of measure, subject to data availability and comparability.
People 25+ with a Bachelor's Degree or Higher Census Place: Ross
People 25+ with a Bachelor's Degree or Higher Census Place: Ross
82.1%
(2018-2022)
Compared to:
CA Census Places
The distribution is based on data from 1,482 locales.
U.S. Census Places
The distribution is based on data from 28,880 U.S. Census Places.
Marin, CA County Value
(61.1%)
The regional value is compared to the Marin County value.
CA Value
(35.9%)
The regional value is compared to the California state value.
US Value
(34.3%)
The regional value is compared to the national value.
Trend
This comparison measures the indicator’s values over multiple time periods.<br>The Mann-Kendall Test for Statistical Significance is used to evaluate the trend<br>over 4 to 10 periods of measure, subject to data availability and comparability.
People 25+ with a Bachelor's Degree or Higher Census Place: San Anselmo
People 25+ with a Bachelor's Degree or Higher Census Place: San Anselmo
70.2%
(2018-2022)
Compared to:
CA Census Places
The distribution is based on data from 1,482 locales.
U.S. Census Places
The distribution is based on data from 28,880 U.S. Census Places.
Marin, CA County Value
(61.1%)
The regional value is compared to the Marin County value.
CA Value
(35.9%)
The regional value is compared to the California state value.
US Value
(34.3%)
The regional value is compared to the national value.
Trend
This comparison measures the indicator’s values over multiple time periods.<br>The Mann-Kendall Test for Statistical Significance is used to evaluate the trend<br>over 4 to 10 periods of measure, subject to data availability and comparability.
People 25+ with a Bachelor's Degree or Higher Census Place: San Geronimo
People 25+ with a Bachelor's Degree or Higher Census Place: San Geronimo
91.7%
(2018-2022)
Compared to:
CA Census Places
The distribution is based on data from 1,482 locales.
U.S. Census Places
The distribution is based on data from 28,880 U.S. Census Places.
Marin, CA County Value
(61.1%)
The regional value is compared to the Marin County value.
CA Value
(35.9%)
The regional value is compared to the California state value.
US Value
(34.3%)
The regional value is compared to the national value.
Trend
This comparison measures the indicator’s values over multiple time periods.<br>The Mann-Kendall Test for Statistical Significance is used to evaluate the trend<br>over 4 to 10 periods of measure, subject to data availability and comparability.
People 25+ with a Bachelor's Degree or Higher Census Place: San Rafael
People 25+ with a Bachelor's Degree or Higher Census Place: San Rafael
49.6%
(2018-2022)
Compared to:
CA Census Places
The distribution is based on data from 1,482 locales.
U.S. Census Places
The distribution is based on data from 28,880 U.S. Census Places.
Marin, CA County Value
(61.1%)
The regional value is compared to the Marin County value.
CA Value
(35.9%)
The regional value is compared to the California state value.
US Value
(34.3%)
The regional value is compared to the national value.
Trend
This comparison measures the indicator’s values over multiple time periods.<br>The Mann-Kendall Test for Statistical Significance is used to evaluate the trend<br>over 4 to 10 periods of measure, subject to data availability and comparability.
People 25+ with a Bachelor's Degree or Higher Census Place: Santa Venetia
People 25+ with a Bachelor's Degree or Higher Census Place: Santa Venetia
47.2%
(2018-2022)
Compared to:
CA Census Places
The distribution is based on data from 1,482 locales.
U.S. Census Places
The distribution is based on data from 28,880 U.S. Census Places.
Marin, CA County Value
(61.1%)
The regional value is compared to the Marin County value.
CA Value
(35.9%)
The regional value is compared to the California state value.
US Value
(34.3%)
The regional value is compared to the national value.
Trend
This comparison measures the indicator’s values over multiple time periods.<br>The Mann-Kendall Test for Statistical Significance is used to evaluate the trend<br>over 4 to 10 periods of measure, subject to data availability and comparability.
People 25+ with a Bachelor's Degree or Higher Census Place: Sausalito
People 25+ with a Bachelor's Degree or Higher Census Place: Sausalito
76.0%
(2018-2022)
Compared to:
CA Census Places
The distribution is based on data from 1,482 locales.
U.S. Census Places
The distribution is based on data from 28,880 U.S. Census Places.
Marin, CA County Value
(61.1%)
The regional value is compared to the Marin County value.
CA Value
(35.9%)
The regional value is compared to the California state value.
US Value
(34.3%)
The regional value is compared to the national value.
Trend
This comparison measures the indicator’s values over multiple time periods.<br>The Mann-Kendall Test for Statistical Significance is used to evaluate the trend<br>over 4 to 10 periods of measure, subject to data availability and comparability.
People 25+ with a Bachelor's Degree or Higher Census Place: Sleepy Hollow
People 25+ with a Bachelor's Degree or Higher Census Place: Sleepy Hollow
83.7%
(2018-2022)
Compared to:
CA Census Places
The distribution is based on data from 1,482 locales.
U.S. Census Places
The distribution is based on data from 28,880 U.S. Census Places.
Marin, CA County Value
(61.1%)
The regional value is compared to the Marin County value.
CA Value
(35.9%)
The regional value is compared to the California state value.
US Value
(34.3%)
The regional value is compared to the national value.
Trend
This comparison measures the indicator’s values over multiple time periods.<br>The Mann-Kendall Test for Statistical Significance is used to evaluate the trend<br>over 4 to 10 periods of measure, subject to data availability and comparability.
People 25+ with a Bachelor's Degree or Higher Census Place: Stinson Beach
People 25+ with a Bachelor's Degree or Higher Census Place: Stinson Beach
58.5%
(2018-2022)
Compared to:
CA Census Places
The distribution is based on data from 1,482 locales.
U.S. Census Places
The distribution is based on data from 28,880 U.S. Census Places.
Marin, CA County Value
(61.1%)
The regional value is compared to the Marin County value.
CA Value
(35.9%)
The regional value is compared to the California state value.
US Value
(34.3%)
The regional value is compared to the national value.
Trend
This comparison measures the indicator’s values over multiple time periods.<br>The Mann-Kendall Test for Statistical Significance is used to evaluate the trend<br>over 4 to 10 periods of measure, subject to data availability and comparability.
People 25+ with a Bachelor's Degree or Higher Census Place: Strawberry
People 25+ with a Bachelor's Degree or Higher Census Place: Strawberry
75.8%
(2018-2022)
Compared to:
CA Census Places
The distribution is based on data from 1,482 locales.
U.S. Census Places
The distribution is based on data from 28,880 U.S. Census Places.
Marin, CA County Value
(61.1%)
The regional value is compared to the Marin County value.
CA Value
(35.9%)
The regional value is compared to the California state value.
US Value
(34.3%)
The regional value is compared to the national value.
Trend
This comparison measures the indicator’s values over multiple time periods.<br>The Mann-Kendall Test for Statistical Significance is used to evaluate the trend<br>over 4 to 10 periods of measure, subject to data availability and comparability.
People 25+ with a Bachelor's Degree or Higher Census Place: Tamalpais-Homestead Valley
People 25+ with a Bachelor's Degree or Higher Census Place: Tamalpais-Homestead Valley
82.4%
(2018-2022)
Compared to:
CA Census Places
The distribution is based on data from 1,482 locales.
U.S. Census Places
The distribution is based on data from 28,880 U.S. Census Places.
Marin, CA County Value
(61.1%)
The regional value is compared to the Marin County value.
CA Value
(35.9%)
The regional value is compared to the California state value.
US Value
(34.3%)
The regional value is compared to the national value.
Trend
This comparison measures the indicator’s values over multiple time periods.<br>The Mann-Kendall Test for Statistical Significance is used to evaluate the trend<br>over 4 to 10 periods of measure, subject to data availability and comparability.
People 25+ with a Bachelor's Degree or Higher Census Place: Tiburon
People 25+ with a Bachelor's Degree or Higher Census Place: Tiburon
77.8%
(2018-2022)
Compared to:
CA Census Places
The distribution is based on data from 1,482 locales.
U.S. Census Places
The distribution is based on data from 28,880 U.S. Census Places.
Marin, CA County Value
(61.1%)
The regional value is compared to the Marin County value.
CA Value
(35.9%)
The regional value is compared to the California state value.
US Value
(34.3%)
The regional value is compared to the national value.
Trend
This comparison measures the indicator’s values over multiple time periods.<br>The Mann-Kendall Test for Statistical Significance is used to evaluate the trend<br>over 4 to 10 periods of measure, subject to data availability and comparability.
People 25+ with a Bachelor's Degree or Higher Census Place: Tomales
People 25+ with a Bachelor's Degree or Higher Census Place: Tomales
42.3%
(2018-2022)
Compared to:
CA Census Places
The distribution is based on data from 1,482 locales.
U.S. Census Places
The distribution is based on data from 28,880 U.S. Census Places.
Marin, CA County Value
(61.1%)
The regional value is compared to the Marin County value.
CA Value
(35.9%)
The regional value is compared to the California state value.
US Value
(34.3%)
The regional value is compared to the national value.
Trend
This comparison measures the indicator’s values over multiple time periods.<br>The Mann-Kendall Test for Statistical Significance is used to evaluate the trend<br>over 4 to 10 periods of measure, subject to data availability and comparability.
People 25+ with a Bachelor's Degree or Higher Census Place: Woodacre
People 25+ with a Bachelor's Degree or Higher Census Place: Woodacre
70.9%
(2018-2022)
Compared to:
CA Census Places
The distribution is based on data from 1,482 locales.
U.S. Census Places
The distribution is based on data from 28,880 U.S. Census Places.
Marin, CA County Value
(61.1%)
The regional value is compared to the Marin County value.
CA Value
(35.9%)
The regional value is compared to the California state value.
US Value
(34.3%)
The regional value is compared to the national value.
Trend
This comparison measures the indicator’s values over multiple time periods.<br>The Mann-Kendall Test for Statistical Significance is used to evaluate the trend<br>over 4 to 10 periods of measure, subject to data availability and comparability.
People 25+ with a Bachelor's Degree or Higher Zip Code: Belvedere, Tiburon (94920)
People 25+ with a Bachelor's Degree or Higher Zip Code: Belvedere, Tiburon (94920)
79.3%
(2018-2022)
Compared to:
CA Zip Codes
The distribution is based on data from 1,761 California zip codes.
U.S. Zip Codes
The distribution is based on data from 32,998 U.S. zip codes.
Marin, CA County Value
(61.1%)
The regional value is compared to the Marin County value.
Trend
This comparison measures the indicator’s values over multiple time periods.<br>The Mann-Kendall Test for Statistical Significance is used to evaluate the trend<br>over 4 to 10 periods of measure, subject to data availability and comparability.
People 25+ with a Bachelor's Degree or Higher Zip Code: Bolinas (94924)
People 25+ with a Bachelor's Degree or Higher Zip Code: Bolinas (94924)
52.6%
(2018-2022)
Compared to:
CA Zip Codes
The distribution is based on data from 1,761 California zip codes.
U.S. Zip Codes
The distribution is based on data from 32,998 U.S. zip codes.
Marin, CA County Value
(61.1%)
The regional value is compared to the Marin County value.
Trend
This comparison measures the indicator’s values over multiple time periods.<br>The Mann-Kendall Test for Statistical Significance is used to evaluate the trend<br>over 4 to 10 periods of measure, subject to data availability and comparability.
People 25+ with a Bachelor's Degree or Higher Zip Code: Corte Madera (94925)
People 25+ with a Bachelor's Degree or Higher Zip Code: Corte Madera (94925)
76.3%
(2018-2022)
Compared to:
CA Zip Codes
The distribution is based on data from 1,761 California zip codes.
U.S. Zip Codes
The distribution is based on data from 32,998 U.S. zip codes.
Marin, CA County Value
(61.1%)
The regional value is compared to the Marin County value.
Trend
This comparison measures the indicator’s values over multiple time periods.<br>The Mann-Kendall Test for Statistical Significance is used to evaluate the trend<br>over 4 to 10 periods of measure, subject to data availability and comparability.
People 25+ with a Bachelor's Degree or Higher Zip Code: Dillon Beach (94929)
People 25+ with a Bachelor's Degree or Higher Zip Code: Dillon Beach (94929)
82.2%
(2018-2022)
Compared to:
CA Zip Codes
The distribution is based on data from 1,761 California zip codes.
U.S. Zip Codes
The distribution is based on data from 32,998 U.S. zip codes.
Marin, CA County Value
(61.1%)
The regional value is compared to the Marin County value.
Trend
This comparison measures the indicator’s values over multiple time periods.<br>The Mann-Kendall Test for Statistical Significance is used to evaluate the trend<br>over 4 to 10 periods of measure, subject to data availability and comparability.
People 25+ with a Bachelor's Degree or Higher Zip Code: Fairfax (94930)
People 25+ with a Bachelor's Degree or Higher Zip Code: Fairfax (94930)
68.2%
(2018-2022)
Compared to:
CA Zip Codes
The distribution is based on data from 1,761 California zip codes.
U.S. Zip Codes
The distribution is based on data from 32,998 U.S. zip codes.
Marin, CA County Value
(61.1%)
The regional value is compared to the Marin County value.
Trend
This comparison measures the indicator’s values over multiple time periods.<br>The Mann-Kendall Test for Statistical Significance is used to evaluate the trend<br>over 4 to 10 periods of measure, subject to data availability and comparability.
People 25+ with a Bachelor's Degree or Higher Zip Code: Forest Knolls (94933)
People 25+ with a Bachelor's Degree or Higher Zip Code: Forest Knolls (94933)
49.2%
(2018-2022)
Compared to:
CA Zip Codes
The distribution is based on data from 1,761 California zip codes.
U.S. Zip Codes
The distribution is based on data from 32,998 U.S. zip codes.
Marin, CA County Value
(61.1%)
The regional value is compared to the Marin County value.
Trend
This comparison measures the indicator’s values over multiple time periods.<br>The Mann-Kendall Test for Statistical Significance is used to evaluate the trend<br>over 4 to 10 periods of measure, subject to data availability and comparability.
People 25+ with a Bachelor's Degree or Higher Zip Code: Greenbrae, Kentfield (94904)
People 25+ with a Bachelor's Degree or Higher Zip Code: Greenbrae, Kentfield (94904)
71.5%
(2018-2022)
Compared to:
CA Zip Codes
The distribution is based on data from 1,761 California zip codes.
U.S. Zip Codes
The distribution is based on data from 32,998 U.S. zip codes.
Marin, CA County Value
(61.1%)
The regional value is compared to the Marin County value.
Trend
This comparison measures the indicator’s values over multiple time periods.<br>The Mann-Kendall Test for Statistical Significance is used to evaluate the trend<br>over 4 to 10 periods of measure, subject to data availability and comparability.
People 25+ with a Bachelor's Degree or Higher Zip Code: Inverness (94937)
People 25+ with a Bachelor's Degree or Higher Zip Code: Inverness (94937)
58.8%
(2018-2022)
Compared to:
CA Zip Codes
The distribution is based on data from 1,761 California zip codes.
U.S. Zip Codes
The distribution is based on data from 32,998 U.S. zip codes.
Marin, CA County Value
(61.1%)
The regional value is compared to the Marin County value.
Trend
This comparison measures the indicator’s values over multiple time periods.<br>The Mann-Kendall Test for Statistical Significance is used to evaluate the trend<br>over 4 to 10 periods of measure, subject to data availability and comparability.
People 25+ with a Bachelor's Degree or Higher Zip Code: Lagunitas (94938)
People 25+ with a Bachelor's Degree or Higher Zip Code: Lagunitas (94938)
54.2%
(2018-2022)
Compared to:
CA Zip Codes
The distribution is based on data from 1,761 California zip codes.
U.S. Zip Codes
The distribution is based on data from 32,998 U.S. zip codes.
Marin, CA County Value
(61.1%)
The regional value is compared to the Marin County value.
Trend
This comparison measures the indicator’s values over multiple time periods.<br>The Mann-Kendall Test for Statistical Significance is used to evaluate the trend<br>over 4 to 10 periods of measure, subject to data availability and comparability.
